

Examples
Basic Usage
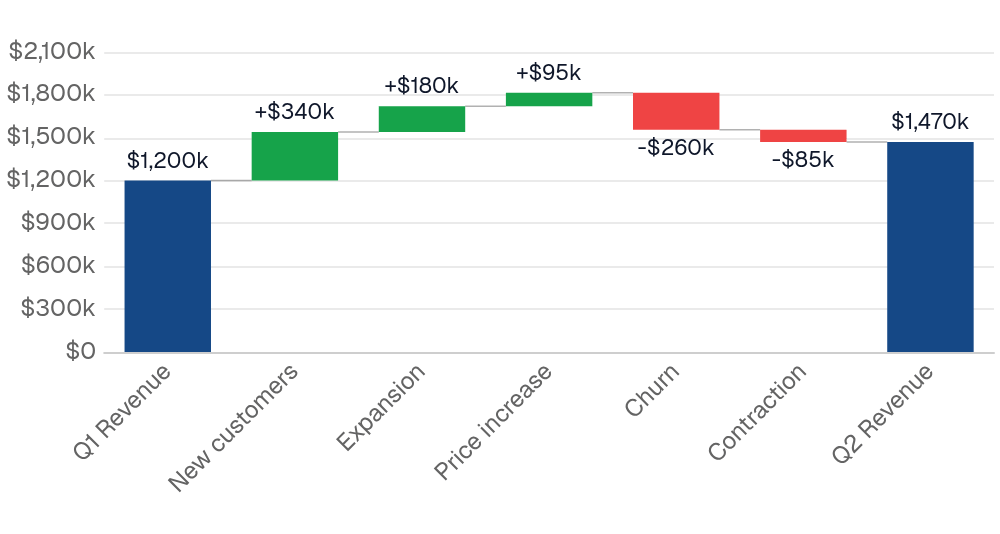
Marking totals by label
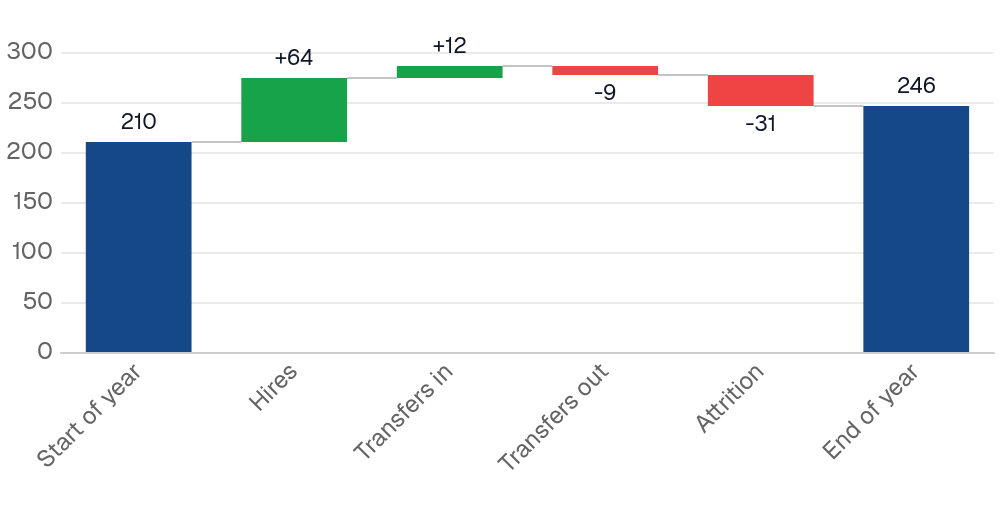
From raw data
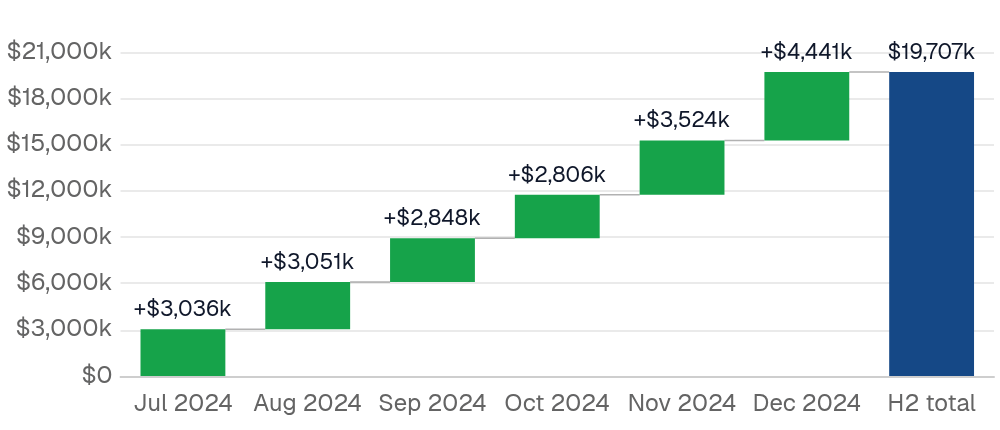
Build-up over time
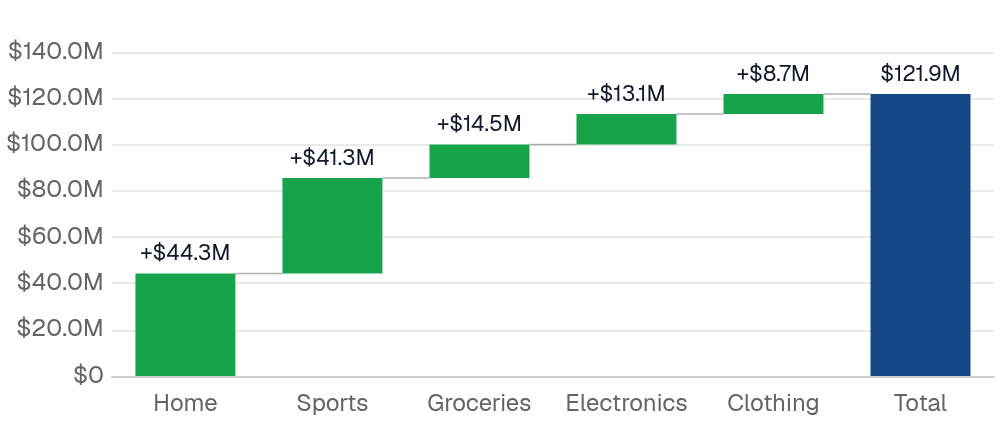
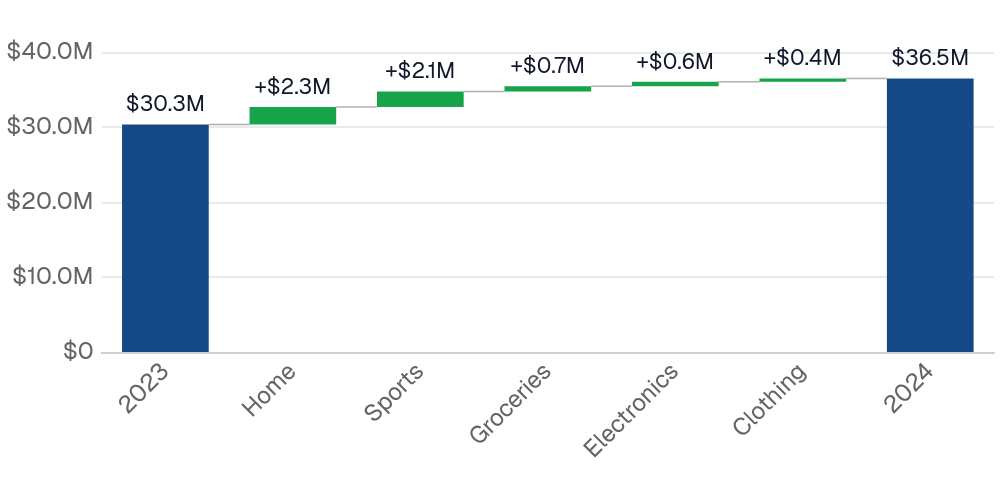
Change between periods, by dimension
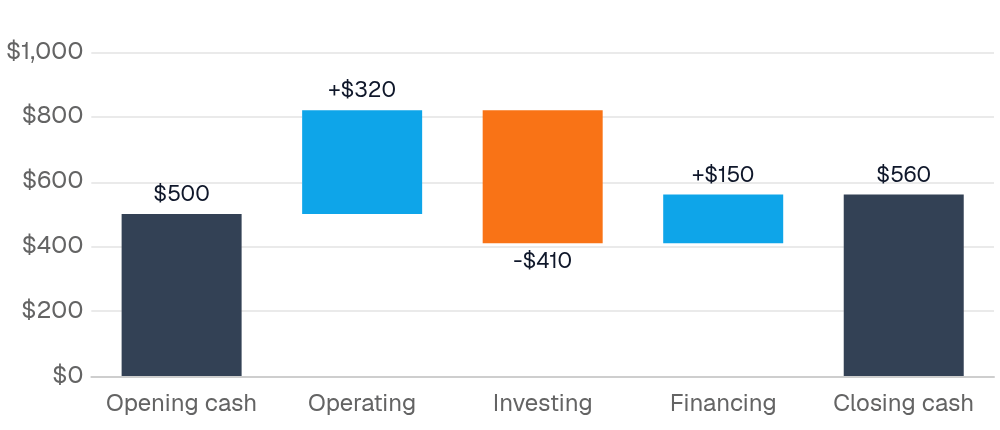
Custom colors and no connectors
Data structure
One row per bar, in display order.x is the label and y is the change: positive rises, negative falls. Running totals are computed by the chart; do not pre-compute them in SQL.
Pre-summarized rows (a plain y column) are read in query order. SQL does not guarantee an order without ORDER BY, so include a step number and pass order="step_order", or list the labels in x_sort.
Raw rows (an aggregate y such as sum(amount)) are grouped by x and sorted largest change first. Override with x_sort or order.
Totals
A total bar is drawn from zero and resets the running total. Mark total rows withbar_type="kind" (a column whose value is total or subtotal) or totals=["Start", "End"] (a list of labels). A total row with a NULL value takes the running total, so an “End” row needs no value. Unless the last row is a total, a computed Total bar is appended; set total=false to suppress it.
Patterns
One row per bar
Events with a bar-label column
x="date" date_grain="month" x_sort="asc" on the same table.
Events whose bar label is derived
Label each row in SQL, keeping the sign, and let the chart aggregate.Bridge between two balances
The start is a total, the movements are aGROUP BY, and the end is a NULL total the chart computes. If the computed end differs from the real closing balance, the movements do not reconcile.
CASE.
Before/after snapshots by a dimension
breakdown_limit folds small contributors into an “Other” bar. A value present in only one period counts as moving from or to zero.
Styling
Per-kind colors are set inchart_options: increase_color, decrease_color, total_color, label_color (a color, or inherit to match each bar) and connector_color.
echarts_options deep-merges over the whole chart configuration, as on other charts.
The bars, labels and connectors are drawn by a custom series, so echarts_series_options supports these keys:
Other series keys (
z, silent, animation) pass through unchanged.
Attributes
string
required
Name of the table or view to query
array
IDs of filters to apply to the query
options group
Filter data to a time period. Attributes:
date_range is an OBJECT with range (the period) and optionally date (which column to filter on when the table has more than one). Shape: date_range={ range="last 12 months" date="order_date" }. range accepts predefined values (last 7 days, month to date), dynamic patterns (Last 90 days), custom windows (2020-01-01 to 2023-03-01), or partial ranges (from 2020-01-01, until 2023-03-01). Pass a plain string for range — the whole object is NOT a string.Example:- range:
string- Time period to filter. Use presets like ‘last 7 days’, dynamic patterns like ‘Last 90 days’, custom ranges like ‘2020-01-01 to 2023-03-01’, or partial ranges like ‘from 2020-01-01’.- Allowed values:
todayyesterdaylast 7 dayslast 30 dayslast 3 monthslast 6 monthslast 12 monthsprevious weekprevious monthprevious quarterprevious yearthis weekthis monththis quarterthis yearnext weeknext monthnext quarternext yearweek to datemonth to datequarter to dateyear to dateall time
- Allowed values:
- date:
string- Date column to filter on. Required when the data has multiple date columns.
string
Bucket dates into a grain. Pass the raw date column as
x and the chart truncates and groups for you. Temporal grains (day, week, month, quarter, year, hour) preserve the year — use for time-series. Seasonality grains (day of week, day of month, day of year, week of year, month of year, quarter of year) collapse across years — use for cyclical patterns like “which month sells most regardless of year”.Allowed values:dayweekmonthquarteryearhourday of weekday of monthday of yearweek of yearmonth of yearquarter of year
string
required
Column that labels each bar. With an aggregate
y, one bar per distinct value; add date_grain to bucket a date column.string
required
The change for each bar: positive rises, negative falls. A plain column reads pre-summarized rows in query order; an aggregate such as
sum(amount) groups raw rows by x. On a total row, y is the absolute total.string
Column that marks total rows. Values
total or subtotal (case-insensitive) draw a bar from zero and reset the running total; anything else is a change.string
Explain the change between consecutive
x values by this column. Each x value becomes a total bar; between two totals, one bar per breakdown value shows how much it moved. Requires an aggregate y. Cannot be combined with bar_type, totals or tooltip_fields.number
With
breakdown, keep this many contributors per span (by absolute change) and fold the rest into an “Other” bar.array
x labels of the total rows, e.g. totals=["Starting ARR", "Ending ARR"]. An alternative to bar_type when the query has no marker column. An entry that matches no row is an error.boolean
default:"true"
Append a computed total bar after the last row. Skipped when the last row is already a total.
string
default:"Total"
Label for the computed total bar
string
Bar order. By default a plain
y keeps query order and an aggregate y sorts largest change first. asc/desc sort by label, value_asc/value_desc by change, or pass a label array such as ["Start", "New", "Churn"]. order (raw SQL) overrides all of these.Allowed values:ascdescvalue_ascvalue_desc
string
Title to display above the component
string
Subtitle to display below the title
string
Information tooltip text (can only be used with title). Displays an info icon next to the title.
string
URL to link the info text to (can only be used with info)
string
Create a custom link title for the info link, placed after the info text (can only be used with info_link)
string
Format for bar labels on the x-axis (useful when
x is a date). See Value Formatting for available formats.string
Format for values — applied to the y-axis, data labels and tooltip. See Value Formatting for available formats.
boolean
default:"true"
Show the value on each bar, signed for changes. Labels hide when the bars are too narrow for them.
boolean
default:"true"
Draw the line joining each bar to the next
boolean
default:"true"
Show an Increase / Decrease / Total legend for the kinds present
string
default:"top"
Position of the legendAllowed values:
topbottom
options group
Waterfall chart configuration optionsAttributes:
- increase_color:
string- Color for bars that rise. Defaults to the theme positive color. - decrease_color:
string- Color for bars that fall. Defaults to the theme negative color. - total_color:
string- Color for total bars. Defaults to the first theme palette color. - label_color:
string- Color for value labels, orinheritto match each bar. Defaults to the theme foreground. - connector_color:
string- Color of the connector lines. Defaults to the theme muted foreground.
options group
Configure the y-axisAttributes:
- title:
string- Axis title shown above the axis - labels:
boolean- Show/hide axis labels - gridlines:
boolean- Show/hide gridlines - ticks:
boolean - baseline:
boolean- Show/hide the axis line - min:
number- Minimum axis value - max:
number- Maximum axis value - fit_to_data:
boolean- Fit the axis to the bars instead of including 0. Totals then start from the axis minimum; useful when changes are small relative to the totals. - interval:
number- Interval between axis ticks. A suggestion — the actual interval may differ.
options group
Configure the x-axisAttributes:
- labels:
boolean- Show/hide axis labels - ticks:
boolean - baseline:
boolean- Show/hide the axis line - gridlines:
boolean- Show/hide gridlines - label_rotate:
number- Rotation of axis labels in degrees. Overrides the automatic rotation.
number
Time in seconds between automatic data refreshes (minimum 30). Overrides the page-level auto-refresh setting for this component.
string
Custom SQL WHERE condition to apply to the query. For date filters, use date_range instead.
string
Custom SQL HAVING condition to apply to the query after GROUP BY
number
Maximum number of rows to return from the query. Note: When used with tables, limit will disable subtotals to prevent incomplete subtotal rows.
string
Column name(s) with optional direction (e.g. “column_name”, “column_name desc”)
string
Custom SQL QUALIFY condition to filter windowed results
number
Set the width of this component (in percent) relative to the page width
number
Set a fixed height for the chart in pixels
string
Link this chart to others sharing the same id, syncing their tooltips, axis-pointer, and zoom
array
Extra columns to include in the tooltip on hover. Each entry is
{ value, label?, fmt?, color_by_sign?, down_is_good? }. See the tooltip fields guide for examples.map
Raw ECharts options deep-merged over the chart’s final configuration. Use for anything the structured props do not expose —
graphic, visualMap, tooltip styling, and so on. Partial overrides win key-by-key without clobbering Studio’s computed siblings. For overrides scoped to the data series, use echarts_series_options.Example:map
Raw ECharts series options deep-merged into the chart series. Use for series-level styling the structured props do not expose.Example: