

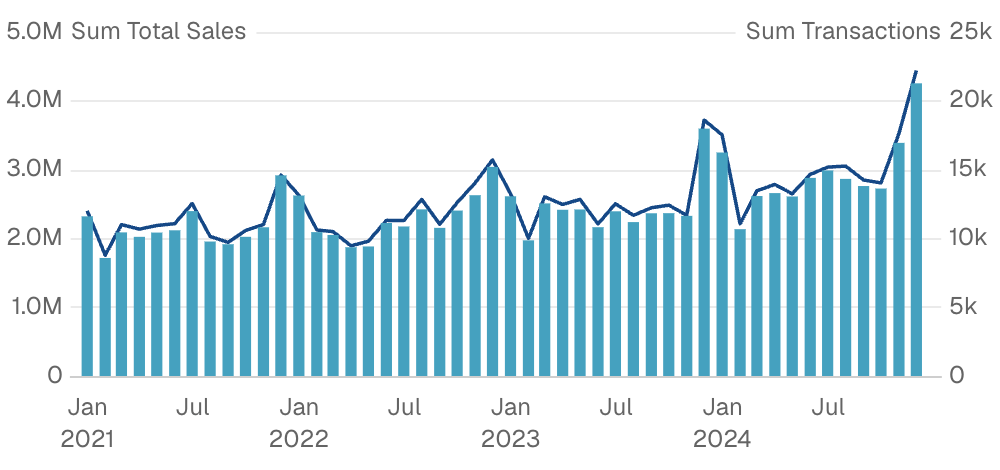
Examples
Basic Usage
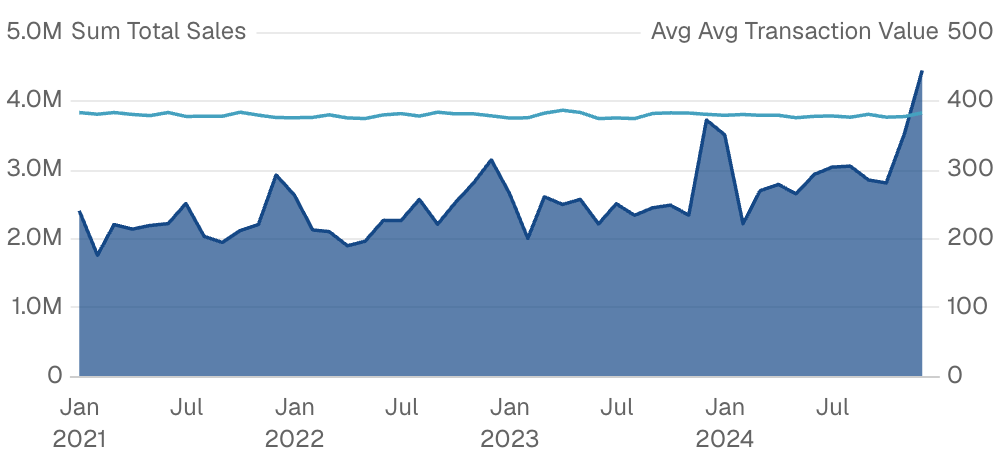
Combo Chart with Area and Line
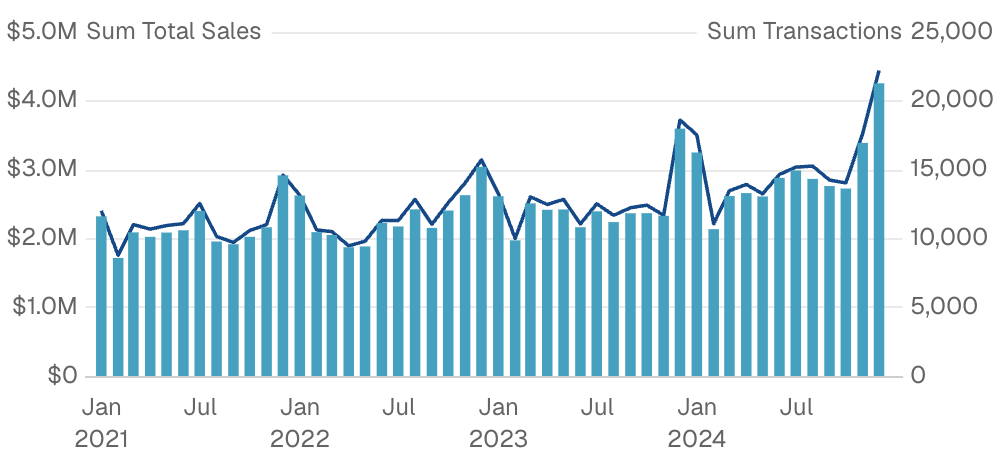
Combo Chart with Formatting
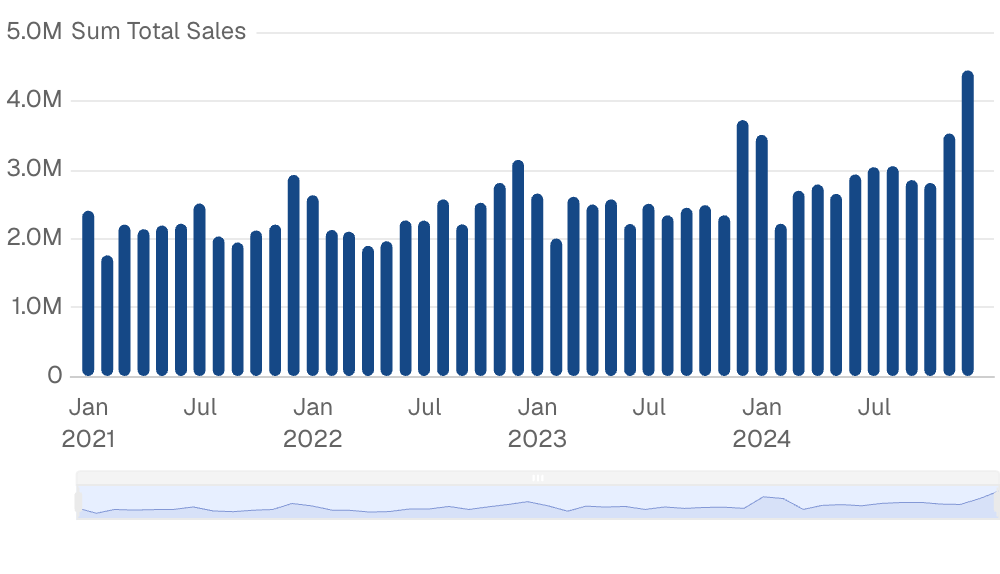
Raw ECharts overrides
Attributes
Name of the table to query. Required unless every child series uses
metric="..." — metric children resolve their own base from the metric view.Filter data to a time period. Attributes:
date_range is an OBJECT with range (the period) and optionally date (which column to filter on when the table has more than one). Shape: date_range={ range="last 12 months" date="order_date" }. range accepts predefined values (last 7 days, month to date), dynamic patterns (Last 90 days), custom windows (2020-01-01 to 2023-03-01), or partial ranges (from 2020-01-01, until 2023-03-01). Pass a plain string for range — the whole object is NOT a string.Example:- range:
string- Time period to filter. Use presets like ‘last 7 days’, dynamic patterns like ‘Last 90 days’, custom ranges like ‘2020-01-01 to 2023-03-01’, or partial ranges like ‘from 2020-01-01’.- Allowed values:
todayyesterdaylast 7 dayslast 30 dayslast 3 monthslast 6 monthslast 12 monthsprevious weekprevious monthprevious quarterprevious yearthis weekthis monththis quarterthis yearnext weeknext monthnext quarternext yearweek to datemonth to datequarter to dateyear to dateall time
- Allowed values:
- date:
string- Date column to filter on. Required when the data has multiple date columns.
Bucket dates into a grain. Pass the raw date column as
x and the chart truncates and groups for you. Temporal grains (day, week, month, quarter, year, hour) preserve the year — use for time-series. Seasonality grains (day of week, day of month, day of year, week of year, month of year, quarter of year) collapse across years — use for cyclical patterns like “which month sells most regardless of year”.Allowed values:dayweekmonthquarteryearhourday of weekday of monthday of yearweek of yearmonth of yearquarter of year
How to handle missing data points. “connect” auto-connects points (default), “gaps” shows visual breaks, “zero” fills with zeros.Allowed values:
connectgapszero
Column name for x-axis. Required unless every child series uses
metric="..." — metric children fall back to the metric view’s time column.Format for x values and axis labels. See Value Formatting for available formats.
Format for y values and axis labels. See Value Formatting for available formats.
Format for y2 values and axis labels. See Value Formatting for available formats.
Information tooltip text (can only be used with title). Displays an info icon next to the title.
Create a custom link title for the info link, placed after the info text (can only be used with info_link)
Time in seconds between automatic data refreshes (minimum 30). Overrides the page-level auto-refresh setting for this component.
Maximum number of rows to return from the query. Note: When used with tables, limit will disable subtotals to prevent incomplete subtotal rows.
Sort order for x-axis categories. Options:
asc (alphabetical), desc (reverse alphabetical), data (preserve query order), or an array for custom order like ["A", "B", "C"]Allowed values:ascdescdata
Configure the y-axisExample:Attributes:
- title:
string - title_position:
string- Position of the axis title. “top” places it horizontally at the top, “side” places it vertically along the axis. Defaults to “side” for 100% stacked charts, “top” otherwise.- Allowed values:
topside
- Allowed values:
- ticks:
boolean - baseline:
boolean - labels:
boolean- Show/hide axis labels - gridlines:
boolean- Show/hide gridlines - min:
number- Minimum value for this axis (number for numeric axes, date string for date axes) - max:
number- Maximum value for this axis (number for numeric axes, date string for date axes) - fit_to_data:
boolean- Fit the axis to the data instead of including 0 - interval:
number- Interval between axis ticks for numeric axes. This option is a suggestion, the actual interval may differ.
Configure the secondary y-axisExample:Attributes:
- title:
string - title_position:
string- Position of the axis title. “top” places it horizontally at the top, “side” places it vertically along the axis. Defaults to “side” for 100% stacked charts, “top” otherwise.- Allowed values:
topside
- Allowed values:
- ticks:
boolean - baseline:
boolean - labels:
boolean- Show/hide axis labels - gridlines:
boolean- Show/hide gridlines - min:
number- Minimum value for this axis (number for numeric axes, date string for date axes) - max:
number- Maximum value for this axis (number for numeric axes, date string for date axes) - fit_to_data:
boolean- Fit the axis to the data instead of including 0 - interval:
number- Interval between axis ticks for numeric axes. This option is a suggestion, the actual interval may differ.
Configure the x-axisExample:Attributes:
- title:
string - show_title:
boolean- Whentrue, renders the auto-derived axis title (the x column name) below the chart. Ignored whentitleis set explicitly. Defaults tofalse— auto-derived column-name titles usually read as visual noise and the axis labels speak for themselves. - label_wrap:
boolean - ticks:
boolean - baseline:
boolean - labels:
boolean- Show/hide axis labels - gridlines:
boolean- Show/hide gridlines - min:
number- Minimum value for this axis (number for numeric axes, date string for date axes) - max:
number- Maximum value for this axis (number for numeric axes, date string for date axes) - fit_to_data:
boolean- Fit the axis to the data instead of including 0. Defaults to true for numeric x-axes, false otherwise. - min_interval:
string- Minimum interval between axis ticks for time-based axes. This option is a suggestion, the actual interval may differ.- Allowed values:
yearquartermonthweekdayhour
- Allowed values:
- max_interval:
string- Maximum interval between axis ticks for time-based axes. This option is a suggestion, the actual interval may differ.- Allowed values:
yearquartermonthweekdayhour
- Allowed values:
- interval:
number- Interval between axis ticks for numeric axes. This option is a suggestion, the actual interval may differ. - label_rotate:
number- Rotation angle of axis label in degrees. Positive values rotate clockwise, negative values rotate counter-clockwise. - title_arrow:
boolean- Show/hide the arrow (→) on the axis title - max_label_length:
number- Maximum character length for axis labels. Labels exceeding this length will be truncated with an ellipsis. Defaults to 20 characters when labels are rotated.
Show legend. Studio’s built-in legend renders a compact color swatch + series name. For chart-wide style overrides that need the legend to reflect them precisely (line width, custom symbols, richer styling), set
legend=false and provide legend={ show=true ... } inside echarts_options to use ECharts’ native legend instead.Array of series names to define the order of series in the chart and legend. Series not in the array will appear after the ordered ones.
Studio-shaped chart styling shortcuts (palette, series colors, zoom, padding). For raw ECharts overrides, use Attributes:
echarts_options instead.Example:- color_palette:
array of strings- Array of hex color codes to use for series colors - series_colors:
map of key-value pairs- Map of series names to hex color codes for custom series coloring - zoom:
boolean- Enables zoom by dragging on the chart area - top_padding:
number- Additional padding (in px) above the chart area to prevent labels from being cut off
Raw ECharts options deep-merged over the chart’s final configuration. Use for anything the structured props do not expose —
dataZoom, visualMap, graphic, tooltip styling, and so on. Partial overrides win key-by-key without clobbering Studio’s computed siblings. For per-series overrides, use echarts_series_options or the per-series echarts_options on a line/bar/etc. child.Example:Raw ECharts series options deep-merged into every data series in the chart. Use when the same override should apply to all series. Skips reference lines/areas/points. For a single series, set
echarts_options on the series child instead.Example: