

New Feature
✨ Open external links from HTML blocks and modals
Links in{% html %} blocks and their modals now open in a new tab, and scripts can call evidence.openUrl(url) to send a click on a card or map marker straight to an external tool.<a href="https://…">opens in a new tab;target="_blank"works too but is no longer required.<a href="/project/page">drills through to another page in the app, the same as a markdown link.evidence.openUrl(url)opens an absolutehttp(s)URL in a new tab from a click handler. The report page itself is never redirected.- A block can only open hosts it names. Any
https://hostwritten in the block is allowed automatically; when the URL comes from data, list the host withlinkHosts="support.example.com"on the tag.
Improvement
🚀 Select All in table filters
Table filters now have a Select All option that selects every value matching your search.New Feature
✨ Use a native warehouse connection like Snowflake from the CLI without a connection.yaml
If your Evidence Studio organization connects to Snowflake, BigQuery, or another native warehouse, runevidence login and the CLI queries it through that connection. You no longer need a connection.yaml.New Feature
✨ SQL Server direct connector
Query SQL Server, Azure SQL Database, and Azure SQL Managed Instance directly from Evidence, without syncing data first.- Connect with a SQL login: server, port, database, user, and password.
- TLS is on by default, and you can supply your own CA certificate for servers with a self-signed or internal-CA certificate.
- Row-level security: your SQL Server security policies can filter data per Evidence viewer.
- Works in the CLI:
evidence init --warehouse sqlserverscaffolds aconnection.yaml, and local queries run directly against your server.
New Feature
✨ AI chat in embedded reports
Embedded reports can now show the Evidence AI chat, so your users can ask questions about a report without leaving your application. Embedding customers opt in per session with theenableAIChat parameter on the embed API.Bug Fix
🐛 Organization switching for viewers
Fixed an issue that blocked viewers from switching organizations in the published app.Improvement
🚀 Big values fit two to a line on phones
On phones, big values now sit two to a line instead of stacking one per line.Improvement
🚀 Render html blocks without a card
On pages with card mode enabled,{% html card=false %} renders the block directly on the page background instead of inside a card.New Feature
✨ Preview pages at mobile width in the editor
A new toggle on the editor’s preview pane narrows the preview to phone width, so you can check how a page reads on mobile without resizing your browser.- Mobile-specific behavior shows in the preview too:
detailshonorsopen_mobile, and modals open as they would on a phone, inside the preview. dimension_gridnow wraps based on its own width rather than the browser’s, so it lays out correctly in narrow columns as well as on phones.
Bug Fix
🐛 Stacked areas no longer have holes
Fixed gaps in stacked area charts on date axes when a series has no data for some dates.New Feature
✨ Hide or show content in print without grouping it
New{% hidden_in_print %} and {% only_in_print %} blocks control what appears in printed pages and PDFs, without the blank gaps print_group can leave.Bug Fix
🐛 Reopening an invitation link takes you to your organization
Reopening an invitation you’ve already accepted while signed in now takes you into that organization instead of showing an error.New Feature
✨ Commentary per input selection
Commentary can now be kept separately for each selected value of one or more inputs, alongside the reporting period.View DocumentationNew Feature
✨ Page download options
Hide download options from a published page’s menu with thedownloads page setting.New Feature
✨ Period selector component
Added a period selector input, which can also place a page’s reporting period anywhere on the page.View DocumentationNew Feature
✨ Print-only content
Show content only in printed pages and PDFs with{% print_group print_only=true %}.Improvement
🚀 Improved row layout
Rows can now spread their contents across the full width, for example a heading on the left and a button on the right.View DocumentationNew Feature
✨ Generate Excel Report
A new Generate Excel Report option exports the page as an Excel workbook with a snapshot of the report on the first sheet and a data sheet per component; Download Data now also appears in the CLI.- Download Data is unchanged and still exports data only; pick Generate Excel Report when you want the report snapshot included.
- Hide it with
downloads: { excel: false }in page frontmatter. It is also hidden whenimageordatadownloads are turned off. - The local CLI viewer now has Download Data and Generate Excel Report in its page menu.
New Feature
✨ Attach files to reports
Drop or paste a file into the editor to upload it and insert afile card showing its icon, name, type, and date.Improvement
🚀 Set down_is_good for a whole page
Adddown_is_good: true to a page’s frontmatter to treat decreases as good for every delta on that page.- Applies to
big_value,delta, and table delta columns. A component’s owndown_is_goodstill overrides it. down_is_good=trueon abenchmark_comparisonortarget_comparisonoption is now respected when a component uses thatcomparison_selector.
Bug Fix
🐛 Tables inside repeat blocks now read page inputs
Atable inside a {% repeat %} block now resolves page inputs referenced in its where, having, order, and qualify attributes instead of running with the value missing.- Previously the table only looked at the repeat’s own scope, so
{{my_input}}in these attributes interpolated as empty and the query failed with a syntax error. - Titles and other text attributes on the same table also resolve page inputs correctly now.
Bug Fix
🐛 CLI runs direct-connector projects without reaching Evidence Studio
evidence dev no longer refuses to start when evidence.studio is unreachable for projects with a connection.yaml, evidence upgrade now works on Windows, and the home page honours page_width and cards like every other page.- Projects with a
connection.yamlskip the Studio reachability check entirely; projects on the Evidence Warehouse get a warning (with the failure reason and a proxy hint) instead of a hard exit. evidence devprints which mode it is in — direct connector or managed warehouse — so it is clear whether a login is needed.evidence upgradesupports Windows x64 and Linux arm64, keepsevd.exein sync on Windows, and points to the installer when the update check fails.evidence serveis listed inevidence help.pages/home.mdnow respectspage_width,cards,table_of_contentsand frontmattertheme, matching subpages.
Bug Fix
🐛 Viewer log out fix
Fixed logging out from a published report showing a “Page not found” error and leaving you signed in.Improvement
🚀 Details start state on mobile
Thedetails component has a new open_mobile attribute to choose whether it starts open or collapsed on mobile screens, independently of openView DocumentationNew Feature
✨ Validation summary in the editor
A new indicator in the editor toolbar shows how many validation errors are on the open file. Click it to see every error with its line number, and click an error to jump to it in the editor.- Covers component errors, inline SQL query errors, and config file (yaml) validation.
- Each entry is labeled with the component, query, or config key it belongs to.
- Clicking an error scrolls the editor to the line and highlights it.
Bug Fix
🐛 CLI keeps input selections in the URL
Input components inevidence dev and self-hosted CLI pages now write their selections to the URL and restore them from it, so filtered views can be refreshed, bookmarked and shared like in Studio.Bug Fix
Bug Fix
🐛 Filter defaults no longer appear in URL
Atable_filter with initial_values no longer writes its default into the page URL, so other pages keep showing their own data instead of inheriting that default and filtering against the wrong values.New Feature
✨ Commentary supports workflow periods
Commentary components can now keep separate notes for each reporting period withscope="period".- Period-scoped commentary follows the page’s
workflow.periodpicker, including in PDF renders. - Commentary without
scoperemains page-wide.
New Feature
✨ Waterfall chart
Thewaterfall_chart component is now available - useful for growth decomposition, revenue bridges, and reconciliationsView DocumentationNew Feature
✨ Search team members
Filter your team settings page by name or email with a new search field.Bug Fix
🐛 Slack channel picker finds every channel the bot is in
Fix the scheduled report Slack channel dropdown missing channels the Evidence bot had joined in large workspaces with many channels.Improvement
🚀 Improved content selection in PDF download menu
Simpler click behaviour to select and deselect content in nested sections.Bug Fix
🐛 Table cells only merge within their parent group
Fix table dimension cells merging across rows whose parent dimension values differ, such as after sorting by a measure.Improvement
🚀 Resume GitHub Enterprise connections
GitHub Enterprise Cloud connections can now resume after another organization owner installs the app, with clearer errors and controls for unfinished attempts.- Finish connecting from GitHub integration settings when the installation callback is missed.
- Allow up to seven days for installation after app registration.
- Resume or cancel an unfinished connection instead of creating another app on each retry.
- See an error message and request ID when a connection needs support.
New Feature
✨ Reporting periods
Turn a page into a periodic report with aworkflow.period block in frontmatter.- Adds a period picker at the top right of the page, listing complete calendar periods (day, week, month, quarter or year)
- The selected period is available as the
periodvariable —{{ period.label }}in markdown,{{ period.between }}in SQL - Only finished periods are offered, so a published report doesn’t change while its period is still running
- The selection is kept in the URL, so a link points at a specific period
Bug Fix
🐛 Dropdown options on Cube
Fix data-driven dropdowns returning no options when connected to a Cube warehouse.New Feature
New Feature
✨ More control over color scales
Color scales in tables and map layers now support diverging midpoints and custom value-to-color breakpoints, and behave consistently across both.- Set
midpointto anchor a diverging scale at a value such as 0, andmin/maxto fix the scale bounds. - Use
color_stopsto pin specific colors to specific values. - Diverging scales stay correct even when every value falls on one side of the midpoint.
Improvement
🚀 Improved error display
Components now display syntax and query errors more prominently in the editor.Bug Fix
🐛 Reliable map layer filter updates
Area, point, and heatmap layers now reliably update when filters change their data.Bug Fix
🐛 Table filter values on Snowflake
Fix the table filter returning no selectable values on Snowflake and other uppercase-folding warehouses.New Feature
✨ Folder-Level Access Rules
Add folder-level access rules toaccess.yaml — grant or restrict every page in a directory subtree with a single entry.New Feature
✨ Scheduled Reports
Email reports to your users on a regular schedule, or send one-off reports on demand.View DocumentationNew Feature
✨ Access Viewer AI inside Slack
Connect a Slack workspace in Integration settings and message the Evidence bot to get answers from your data without leaving Slack.- An admin adds the app from Settings → Integrations → Slack, then each person connects their own account — the bot only reads what you can already see.
- Direct message the bot, or @mention it in a channel.
- Answers can display charts, save insights to your library, and link back into Evidence.
- Admins can turn the bot off for the whole organization, and choose whether each person’s first answer in a channel is shown to them before the channel sees it.
Bug Fix
🐛 Partial filter initial values now apply on parent pages
Fixed an issue where filter initial values defined in partials could be empty when rendered on parent pages.Bug Fix
🐛 Filters load in partial page previews
Filters in partials now load when using View another page in the editor.Bug Fix
🐛 Link buttons support relative page URLs
Link buttons now navigate correctly with portable relative URLs across edit, preview, and published reports.Bug Fix
🐛 Table filters close safely without selections
Table filters now remain visible when a numeric or date picker is closed without a selection.Bug Fix
🐛 Sorting a table by a column it does not show
Sorting a table by a column that is not one of its dimensions or measures no longer splits the rows into extra groups, and no longer fails on Postgres, Fabric and Cube.Bug Fix
🐛 ClickHouse conditional aggregates
FixsumIf and its -If siblings breaking date-filtered measures and comparison targets on ClickHouse, and no longer warn that they are missing an aggregation.Bug Fix
🐛 Snowflake table conditional colors
Fix conditional colors on table dimensions in Snowflake for literal colors and SQL expressions.Bug Fix
🐛 Sorting a table by a grouped date column
Sorting a table by a date column that has adate_grain now sorts by the grouped date instead of failing with a grouping error.order="my_date desc"alongside{% dimension value="my_date" date_grain="day" /%}sorted by the raw column, which the warehouse never grouped. ClickHouse rejected the query and the table rendered empty.- A hidden sort column on a table with subtotals is now aggregated, so it no longer breaks the subtotal and total rows.
Bug Fix
🐛 Creating files and folders is disabled on protected branches
The sidebar’s create page, partial, SQL, component, folder, and agent-file actions are now disabled when the current branch is protected on GitHub, matching the existing branch-protection guard on Commit.New Feature
✨ Bring your own model API key
Enterprise organizations can now point both AI agents at their own OpenAI, Anthropic, AWS Bedrock, or Google Vertex account from Settings → AI Agent.- Both the editor agent and the viewer agent use your provider and model, so your provider bills you for inference directly and Evidence AI credits are neither consumed nor charged.
- Credentials are stored in the WorkOS Vault and never sent back to the browser. Saving verifies the credential against your provider first, so a wrong key or model ID is rejected rather than stored.
- There is no fallback to Evidence’s models: if your credential stops working, chat reports a clear error instead of quietly switching back and billing you for credits.
Improvement
🚀 Big value titles are clickable when linked
Settinglink on a big value now turns the title into a styled link instead of the number, matching typical score card conventions.New Feature
✨ Metrics
Evidence now has a metrics layer. Define metrics inmetrics/*.yaml and reference them in charts and tables. Ask the agent to build one for you to get started.New Feature
✨ MCP Visualize Tool
The Evidence Studio Claude Connector and ChatGPT Plugin can now generate charts inline in the chat with the newvisualize tool.New Feature
✨ Reports page for run history and schedules
A new top-level Reports page (next to Models) for viewing report run history and managing schedules.- History tab: View all report runs with status, trigger type (manual/schedule/API), author, timing, and recipient count
- Schedules tab: View and manage recurring report schedules with pause/resume and delete actions
- Admin-only actions: Pause/resume schedules, delete schedules, re-run past reports, download PDFs
- Developer access: Developers (members) can view the page; admins can take all actions
- Entitlement gate: Available on Team, Pro, and Enterprise plans
New Feature
✨ GitHub Enterprise Cloud support
Enterprise organizations can now connect Evidence Studio and the Evidence CLI to GitHub Enterprise Cloud accounts hosted on dedicated*.ghe.com domains.- Create and install a private, organization-owned GitHub App through Organization Settings.
- Select accessible enterprise repositories in Project Settings and use Studio branches, pull requests, checks, and publishing as usual.
- Run
evidence launchorevidence linkfrom HTTPS and SSH GHE.com remotes.
Bug Fix
🐛 Feature request dialogs remain accessible with long descriptions
Feature request dialogs now constrain long descriptions to a scrollable area so their controls remain accessible.Bug Fix
🐛 Table links now work in fullscreen reports
Table links now navigate to their destination while viewing a report in fullscreen presentation mode.New Feature
✨ MotherDuck direct connector
Connect Evidence directly to a MotherDuck database to build reports on live data without syncing it first.View DocumentationNew Feature
✨ Custom Maps
Use thecustom_map component to build fully customized maps with Mapbox GL or MapLibre GL.- Write map code directly in the component body — pull page data with
evidence.query, read and write page filters, and react to variables and theme changes. - No key needed by default: keyless MapLibre out of the box, or Mapbox using Evidence’s shared token under the hood.
- Import map-ecosystem plugins (mapbox-gl-draw, deck.gl, turf, and more) straight from a CDN.
Bug Fix
🐛 Custom HTML and ECharts blocks work in the CLI
{% html %} and {% custom_echart %} blocks now render when running a project locally with the Evidence CLI.- Both blocks previously rendered blank in
evidence dev— the sandbox runtime they load was only built by the hosted app, so the CLI served nothing for it - Requires CLI v0.7.4 or later
- If a sandbox runtime is ever missing, the block now reports an explicit error instead of staying blank
Improvement
🚀 AI chat now consumes far fewer credits
We’ve significantly reduced how many credits AI chat consumes, so your balance goes much further.New Feature
✨ Cube Connector
Connect Evidence directly to your Cube semantic layer through its Postgres-wire SQL API.- Query your cubes and views live from Evidence — metrics stay defined in Cube.
- Configure it in Connectors → Warehouse → Cube (host, port, user, password, SSL), or via
connection.yaml(type: cube) in the CLI. - The SQL editor validates expressions against Cube’s documented function subset, so unsupported functions are flagged before you run a query.
New Feature
✨ PDF “Use page colors” option
Preserve the exact colors from your page when generating PDFs.- New “Use page colors” checkbox in the PDF settings modal (Cmd+P)
- When enabled, PDFs retain the theme’s actual background colors (including dark mode or custom theme backgrounds)
- When disabled (default), PDFs use white backgrounds optimized for printing
- Preview updates to show how the PDF will look with the selected option
New Feature
✨ Postgres Direct Connector
Connect Evidence directly to Postgres — including Amazon RDS/Aurora, Supabase, Neon, and Timescale — and query it live.- Add Postgres under Settings → Warehouse: enter host, port, database, user, password, and SSL mode, test the connection, and save.
- Works with any Postgres-wire source: generic Postgres, Amazon RDS / Aurora, Supabase, Neon, and Timescale.
- Full SSL/TLS support with
disable/require/verify-ca/verify-fullmodes, plus an optional CA bundle and mutual-TLS client certificate. - The schema browser lists tables, views, and materialized views.
- Also available from the CLI via
connection.yaml(type: postgres) orevidence init --warehouse postgres, with certificates referenced by file path.
New Feature
✨ Search across your reports with Cmd+K
Press Cmd/Ctrl+K to instantly search across every report you have access to.New Feature
✨ Viewer AI & Insights
Report viewers can now ask questions of your data in a chat assistant and save the answers as insights to revisit later.Bug Fix
🐛 Fixed editor inserting characters at the wrong position on older reports
Typing in the editor now appears where you clicked on reports created before mid-2026.New Feature
✨ Evidence Studio MCP Server
Search your reports and query your data from your favorite AI client. Connect Claude, ChatGPT, and other MCP clients to your live Evidence workspace — every request runs as the signed-in user, so access policies and page controls are respected.View DocumentationBug Fix
🐛 CLI dev server no longer crashes when a subfolder has an index.md
Nestedindex.md / home.md / README.md files are no longer treated as the home page in the sidebar, so evidence dev renders normally instead of crashing with a duplicate-key error when a project has a root home page plus an index.md in a subfolder.New Feature
✨ Point Map Clustering
You can now include up to 100,000 points in a point layer by usingcluster=true. Nearby points are grouped into aggregated bubbles that split apart as you zoom in, so large datasets stay fast and readable.New Feature
✨ 50 New Data Connectors
Connect 50 more data sources to Evidence, including Zendesk, Intercom, Mixpanel, Amplitude, Square, QuickBooks, Recurly, Pipedrive, Gong, LinkedIn Ads, and more. Set them up in a few clicks from the Connectors page.New Feature
✨ 50 More Data Connectors
Another 50 data sources are now available, including Jira, Airtable, Asana, Notion, Slack, Klaviyo, Mailchimp, Braze, SendGrid, TikTok Ads, Amazon Ads, Google Search Console, ServiceNow, and Okta. Set them up in a few clicks from the Connectors page.New Feature
✨ Lemlist Connector
Connect your Lemlist data to Evidence. Sync campaigns, leads, and activities from your email outreach.View DocumentationImprovement
🚀 Improved chart x-axis and tooltip labels
Better handling of dates and numbers on chart x-axes and tooltips.New Feature
✨ Table Access Restrictions
Restrict tables to a chosen set of usersRestrict specific tables to a chosen set of users from the Access Rules settings page. Unrestricted tables stay open to everyone in the organization, and restricted tables show a lock badge in the editor’s schema list.View DocumentationNew Feature
✨ Image component accepts data queries
Adddata and column props to the image component to load the image URL from a query and respond to filter changes — e.g. show the top-selling product’s photo, a client logo driven by a dropdown, or a dark-mode variant via dark_column.New Feature
✨ Radar, Treemap, and Chord charts
Three new charts now available: radar_chart, treemap, and chord_chartNew Feature
✨ Mix single and multi select columns in table filters
Addsingle_select and multi_select to table_filter to set the selection mode per column — e.g. restrict a client column to one value at a time while keeping region and product filters multi-select.Bug Fix
🐛 Y-axis titles stay legible above chart data
Chart contents no longer overlap the y-axis title — bars, areas, and lines that reach the top of the axis now render beneath the title instead of covering it. Gridlines are cut off cleanly behind the title rather than showing through the text, the title is vertically aligned with the top axis tick label, and a subtle text outline keeps it readable when data passes directly beneath it. Applies to both left and right (y2) axis titles.Bug Fix
🐛 range_calendar “all time” no longer breaks raw SQL
Referencing{{ date_filter.between }} in a where or SQL template while “all time” was selected previously produced an empty string, which broke the query (where date → syntax error). .between now emits IS NOT NULL for “all time”, so where="date {{ date_filter.between }}" matches all rows and just works.The new all_time_range attribute controls what “all time” means for a specific range_calendar:all_time_range="none"restores the previous empty-string behavior — pair it with[[ ]]conditional blocks or a| fallbackwhen the whole clause should drop (e.g. to keep NULL-date rows, whichIS NOT NULLotherwise excludes).- Set it to a bounded range — a preset key (
"last 12 months"), acustom_rangeslabel, or a range expression ("from 2022-12-01") — and “all time” resolves to that range everywhere (.between,.start,.end, and thedate_rangevalue). If you were faking this with a| fallbackin yourwhereclause, setall_time_rangeto that range and delete the fallback.
.start / .end stay empty for unbounded “all time” (so date spines and axes fail loudly rather than silently wrong), and .filter / a filters=[...] reference stay a true no-op that keeps NULL rows.Bug Fix
🐛 Fix for AI chat losing conversation context
Fixed an issue where the AI chat could respond to an earlier message in long conversations instead of the one you just sent.Bug Fix
🐛 Sparkline hover values now use theme foreground
Sparkline hover values and the vertical tracking line follow the theme’s foreground and muted-foreground tokens, restoring contrast in light mode (most visible on big_value sparklines).New Feature
✨ AI Agent Multi-File Edits
The AI dev assistant can now edit multiple files in a single turn — as well as create, rename, and move files.New Feature
✨ Extra tooltip rows on chart series
Addtooltip_fields to any bar_chart / line_chart / area_chart / scatter_chart / bubble_chart — or to bar, line, area, scatter, bubble inside a combo_chart — to surface additional aggregated values on hover, with optional labels, format codes, and color_by_sign / down_is_good for delta-style coloring.New Feature
✨ Link charts together
Addconnect_group to charts to sync their tooltips, axis-pointer, and zoom across any charts sharing the same id — e.g. stack a price chart above a volume chart, align KPIs that share a time axis, or coordinate small multiples.New Feature
✨ Customize built-in charts with ECharts options
Override any ECharts option on built-in charts viaecharts_options (chart-wide) or echarts_series_options (looped across every series).New Feature
✨ Attach images to editor AI chat
Click the image button in the editor chat composer to attach screenshots or other images for the AI agent to see alongside your message.New Feature
✨ Custom components
Build your own Markdoc tags fromcomponents/*.md files — each component declares its attributes in frontmatter and gets autocomplete, slash-command, and AI-tool support just like a built-in.New Feature
✨ Pin color scale values in tables
Anchor a measure’s color scale to specific data values withcolor_stops.New Feature
✨ Custom HTML in reports
Embed your own HTML and JavaScript anywhere in a report with the new{% html %} block. Build custom visualizations that integrate with Evidence’s filters, queries, and theme — using any library, like D3 or deck.gl.Bug Fix
🐛 Hide unneeded subtotal rows in tables
Tables now hide duplicative subtotal rows that only summarize a single item, while keeping the grand total.New Feature
✨ Expanded theme options
Themes now include fonts, colors, corner roundness, spacing density, and chart defaults, applied consistently across the whole report. Override the theme for a single page when you need to.New Feature
✨ Custom date ranges
Addcustom_ranges to {% range_calendar %} to generate named presets — e.g. fiscal years, seasons, and retail calendars.Bug Fix
🐛 Smoother schema panel refresh
The refresh button no longer pushes content down or hides the schema list while reloading, and long table or column names truncate instead of forcing horizontal scroll.New Feature
✨ Show size dimension in bubble and scatter chart tooltips
Bubble and scatter chart tooltips now display the size dimension value, with a newsize_fmt attribute for formatting.Bug Fix
🐛 Faster, more reliable editor preview on heavy pages
Fixed an issue where the editor could lock up on pages with many charts and tables.Bug Fix
🐛 Fix heatmap collapsing at wider screen widths
Fixed heatmap charts collapsing into a small box at certain screen widths.New Feature
✨ Impersonate
Create and manage access tokens for programmatic API access from the new Access Tokens settings page. Admins and developers can impersonate team members to see exactly what they see (disabled by default).Bug Fix
🐛 Fix dropdown search failing on BigQuery
Fixed an issue with searching a dropdown or table filter for BigQuery direct connections.New Feature
✨ Failed Publishes No Longer Affect Viewers
If a publish fails, your project keeps serving the last successful version — viewers never see broken content.Bug Fix
🐛 Fix spurious markdown validation errors on PRs
Fixed the PR markdown-validation check reporting false-positiveundefined-translation-key and undefined-frontmatter-variable errors on pages using translations and on partials that receive variables from the pages including them.New Feature
✨ Publish History & Rollback
View your project’s publish history and roll back to any previous version.New Feature
✨ ClickHouse direct connector
Connect Evidence directly to your own ClickHouse instance to build reports on live data without syncing it first.View DocumentationNew Feature
✨ Make the selected option in button_group and input_tabs more noticeable
The selected button in button_group and the active tab in input_tabs now stand out more clearly.New Feature
✨ New share menu and additive page access
The redesigned share menu lets you grant page-level access on top of project access, so you can share a single dashboard with a stakeholder who shouldn’t see anything else.New Feature
✨ Vibe code any visualization with the custom_echart component
Need a chart Evidence doesn’t have out of the box — a waterfall, a bridge, a radar, something bespoke? The newcustom_echart component lets you build any visualization you can imagine. Describe what you want to the assistant and it writes the chart for you, wired up to your data, filters, and theme automatically.New Feature
✨ Pre-select the top N options in a multi-select dropdown
Multi-select dropdowns now accept adefault_top_n attribute that pre-selects the first N options on load. Combine it with order to control which N are selected by default — which viewers can then change.New Feature
✨ New Publish Menu in Editor
View pending changes and open pull requests directly from Studio.New Feature
✨ See what each user, group, and customer can access
Admins and developers can now see every project and page a user, group, or customer can access, plus how that access was granted.Bug Fix
🐛 Share menu now lets you grant page access to any team member
The Page tab of the share menu now lists every internal team member, so you can grant page access directly without first adding them to the parent project.Improvement
🚀 Add users to groups when inviting, and see group memberships in the team table
Admins can now pick groups when inviting or manually creating users, and the Team settings page shows each member’s group memberships in its own column.Improvement
🚀 HubSpot Connector
Updated the HubSpot connector with more reliable syncs and broader table coverage.View DocumentationNew Feature
✨ Microsoft Fabric direct connector
Connect Evidence directly to a Microsoft Fabric Warehouse or Lakehouse SQL endpoint to build reports on live data without syncing it first.View DocumentationBug Fix
🐛 PDF exports preserve dropdown filter values
PDF exports of pages with aselect_first=true dropdown no longer revert the filter to its auto-selected default when the URL specifies a different value.New Feature
✨ Map area layer min, max, and midpoint
Maparea_layer and point_layer now accept min, max, and midpoint props so you can pin a diverging color scale at zero (or any other value).Bug Fix
🐛 Fixed bar chart tooltip not displaying point_title
Fixed an issue where thepoint_title attribute on bar, line, and area charts was ignored in the tooltip.New Feature
✨ File change indicators in editor sidebar
Files with uncommitted changes now show colored status badges (M/A/D) in the editor sidebar file tree, so you can see which files have been modified without switching to the Version Control tab.New Feature
✨ Copy link to pages
Copy a shareable link to the current page from the page menu, with option to include the current filters.Improvement
🚀 Dedicated Groups settings page
Groups now have their own page under Settings → Groups, separate from team members, with a detail view for managing each group’s members and access.New Feature
✨ Snowflake and BigQuery direct connectors
Link Evidence to Snowflake or BigQuery directly to build reports without syncing data.View DocumentationImprovement
🚀 Improved discoverability of date input components in AI chat
Added search keywords torange_calendar, date_grain_selector, and comparison_selector so the AI assistant can find them when users ask for “date range filter”, “date picker”, “date input”, etc.Improvement
🚀 Long chart label rotation
Charts now rotate long x-axis labels automatically so category names are easier to read without hovering.Bug Fix
🐛 Map area layer filter updates
Fixed a bug where area charts did not respond to filter changes.Bug Fix
🐛 Horizontal bar chart axis bound validation
Thehorizontal_bar_chart now reports a validation error when x_axis_options.min is greater than or equal to x_axis_options.max.New Feature
✨ Evidence CLI now available on Windows
The Evidence CLI now ships a Windows x64 binary, installable via PowerShell:irm https://gaamozau3jchzs3r.public.blob.vercel-storage.com/cli/install.ps1 | iex.View DocumentationImprovement
🚀 Default tab selection
Adddefault=true to a {% tab %} to pre-select it on page load instead of always defaulting to the first tab.Bug Fix
🐛 Data labels render on area and line charts
Fixeddata_labels not appearing on area_chart, line_chart, and combo_chart line/area series.New Feature
✨ Add today and yesterday range calendar presets
Range calendars can now opt into Today and Yesterday preset ranges.Improvement
🚀 Faster Page Create and Rename
Creating, renaming, and reorganizing pages and folders in the editor sidebar is noticeably faster.Bug Fix
🐛 Mobile sidebars close after navigation
Fixed mobile sidebars staying open after selecting a navigation link.Bug Fix
🐛 Improved SQL file support in GitHub integration
Improved how SQL files sync between Studio and GitHub.Bug Fix
🐛 Branch-aware link autocomplete and validation
Editor link autocomplete and validation now include pages that exist only on the current branch, and AI chat no longer flags them as broken.Bug Fix
🐛 AI chat current date awareness
Fixed AI chat date context so the agent knows today’s date when answering in editor and viewer chats.Bug Fix
🐛 Locally-authored pages now appear in Studio
Fixed an issue where files created locally and synced to GitHub were not appearing in Studio.Bug Fix
🐛 Stable heading logo sizing
Fixed an issue where logos inside headings could briefly render at the wrong size on page load.Bug Fix
🐛 Fix unquoted variables in partial attributes
Fixed an issue where unquoted variable references in component attributes failed when rendered from partials.Bug Fix
🐛 Fix x_sort=“data” imposing an x-axis sort
Fixed an issue where settingx_sort="data" on bar and line charts still sorted by the x-axis instead of preserving the source query’s row order.Bug Fix
🐛 Embedded page centering without TOC
Fixed an issue where embedded pages could stay shifted to the left after the table of contents was turned off.Bug Fix
🐛 Stable logo sizing on load
Fixed an issue where logos in headings could briefly render at the wrong size while the page was loading.Bug Fix
🐛 Improved models table readability
Fixed an issue where the models table was not sorted by name by default and long descriptions were hard to scan.New Feature
✨ Select content for PDF exports
Choose which sections and components to include when exporting a PDF.Bug Fix
🐛 Source failure modal fix
Fixed an issue where opening a failed source status could show a blank blocking modal instead of the failure details.Improvement
🚀 Longer AI chat sessions
Increased the maximum AI chat response time so longer agentic conversations no longer time out.Improvement
🚀 Collapsible projects in published and preview sidebars
Projects in the sidebar can now be collapsed and expanded by clicking the project name, with state persisted across sessions.New Feature
✨ Connector renaming
You can now rename connectors directly from the connectors page or the connector detail page by clicking the pencil icon next to the name.Bug Fix
🐛 Dropdown search now handles nullable values safely
Fixed an issue where searching in a dropdown could fail when the value or label column contained empty values.New Feature
✨ Data lineage
See where your connectors and tables are used across projects, pages, models, and queries. Available in the connectors page, connector detail pages, models page, AI chat, and the CLI.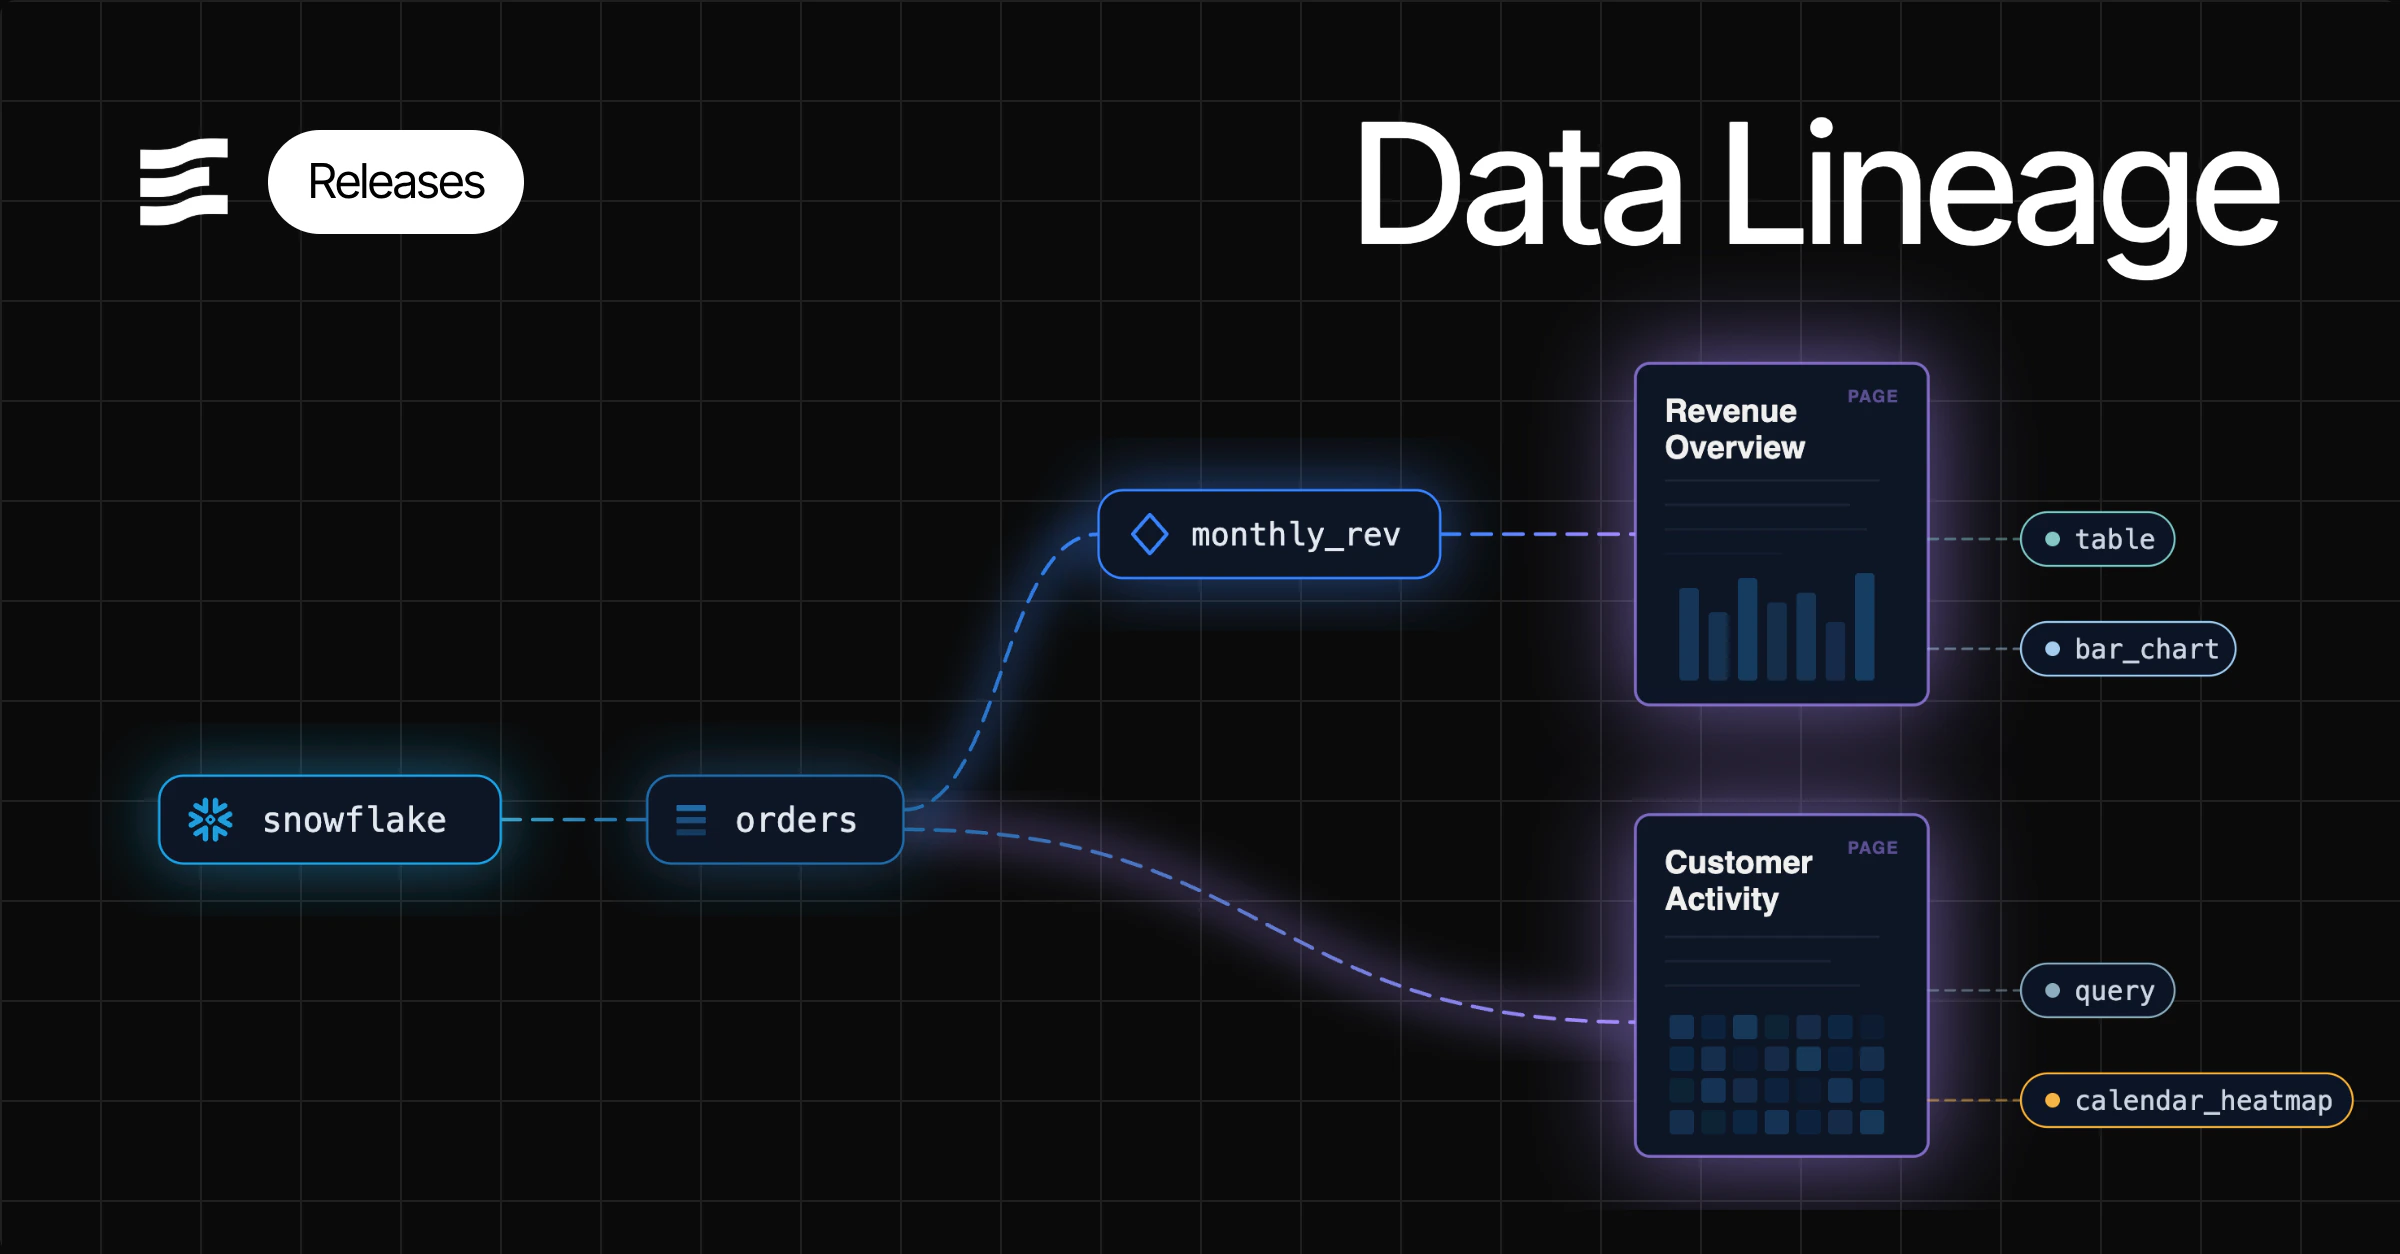
Improvement
🚀 Resizable SQL console schema panel
The SQL console schema panel can now be resized by dragging its edge so long table names are easier to inspect.New Feature
✨ Connector and model health status
Connectors page now shows health status and sync schedule for all connector types. Newconnectors and models CLI commands let you check health statuses from the command line.Bug Fix
🐛 Fixed theme settings loading state while editing colors
Fixed an issue where editing theme color values could cause a broken loading state in settings.Bug Fix
🐛 Fixed inline SQL editor query references
Fixed an issue where inline SQL editor queries could fail when referencing other inline queries.Bug Fix
🐛 Fixed unexpectedly large branch diffs
Fixed an issue where small edits in Git-connected branches could appear as much larger diffs than expected.Bug Fix
🐛 Fixed stacked combo charts on time-based axes
Fixed an issue where stacked combo charts on time-based axes could render blank or incorrect series data.Bug Fix
🐛 Fixed filter bar not floating on scroll in published pages
Fixed an issue where the filter bar would not stay pinned to the top of the page when scrolling in published mode.New Feature
✨ Usage Analytics
Track how your team uses Evidence with built in analytics tables for sessions, users and page views.Bug Fix
🐛 AI theme updates apply instantly
Fixed an issue where theme changes made by the AI assistant only appeared after a page refresh.New Feature
✨ Audio Component
Embed an audio player in your reports with{% audio url="..." /%}. Supports mp3, wav, ogg, and other formats, with options for looping, autoplay, and preload behavior.Bug Fix
🐛 Calendar heatmap dark mode colors
Fixed an issue where calendar heatmaps could show white empty-day cells in dark mode instead of blending with the page or card background.New Feature
✨ Conditional colors for dimensions and rows
Apply conditional background colors to entire rows or individual dimension cells using SQL expressions.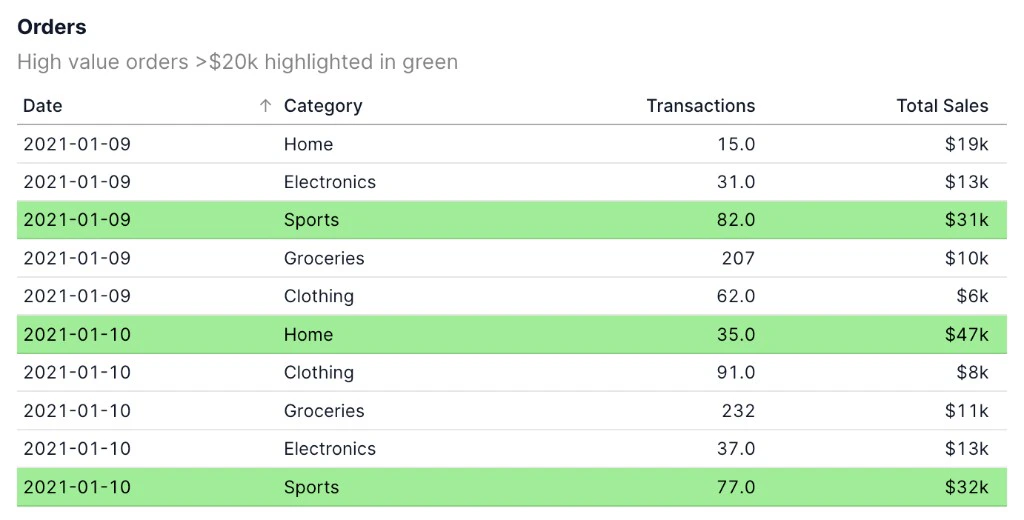
Bug Fix
🐛 Fixed table SQL error overlay spacing
Fixed an issue where table SQL errors could overlap content below the table.Bug Fix
🐛 Expanded background color options for AI theme updates
Expanded the background color options the AI agent can change in theme updates.New Feature
✨ YouTube Analytics Connector
Connect your YouTube Analytics data to Evidence. Sync channel reports, content owner reports, and metadata tables.View DocumentationBug Fix
🐛 Fixed combo chart SQL with toggle-driven inline queries
Fixed an issue where combo charts could fail when inline queries used toggle values in SQL conditions.New Feature
✨ Multiplayer editor
Collaborate with your team in real-time with live cursors and presence indicators.New Feature
✨ Axis titles for heatmaps
Heatmaps now supportx_axis_title and y_axis_title so you can label both axes directly on the chart.Bug Fix
🐛 Fix for table column groups with link attribute
Fixed an issue where adding alink attribute to a table dimension would cause all column groups to disappear.Bug Fix
🐛 Fixed spacing in the back-to-partial label
Fixed an issue where the “Back to partial” label appeared without a space in preview mode.Bug Fix
🐛 Horizontal bar chart axis min/max now apply exactly
Fixed an issue wherex_axis_options.min and x_axis_options.max on horizontal bar charts could be ignored instead of enforcing the requested axis range.New Feature
✨ SAP HANA Connector
Connect your SAP HANA data to Evidence. Sync data from SAP ECC and SAP S/4HANA systems running on the HANA platform.View DocumentationBug Fix
🐛 Fix slider lockup with invalid step values
Fixed an issue where sliders could freeze the page when configured with an invalid step value.New Feature
✨ Third-party analytics for published pages
You can now add your own Google Analytics (GA4) or PostHog tracking to published and embedded pages. Configure your analytics provider in Organization Settings under Third-Party Analytics. Available on Enterprise plans.Improvement
🚀 Collapsible folders in published and preview sidebars
Added click-to-expand and collapse behavior for sidebar folders in published and preview pages to make navigation easier in larger projects.New Feature
✨ Added This Month and Next Month date presets
Range calendars now supportthis month and next month presets so you can filter full calendar months including upcoming dates.Bug Fix
🐛 Dropdown options now support numeric values for initial selection
Fixed an issue where dropdown initial values could fail to apply when option values were provided as numbers.Improvement
🚀 Loading indicator for map components
Map components now show a loading indicator while map data is being fetched so blank maps are less confusing during slow queries.Bug Fix
🐛 Fix for occasional AI chat timeouts
Fixed an issue where the AI agent could appear to run out of time when working with large queries.Bug Fix
🐛 Fix for table search
Fixed an issue where searching in tables could produce errors or fail to recover after clearing a search.Bug Fix
🐛 Fix table sorting when subtotal rows are hidden
Fixed an issue where sorting by measure columns in tables could produce incorrect order when subtotal rows were hidden.Improvement
🚀 Add mmm-yy date format
Added a built-inmmm-yy format code so dates can be displayed as month and two-digit year, like Jan-22.Bug Fix
🐛 Fix mobile sidebar close animation flicker
Fixed an issue where the sidebar would briefly flash back into view at the end of its close animation on mobile devices.Bug Fix
🐛 Comparison column formatting fix
Fixed an issue where prior period comparison columns in tables did not apply the same number format as the main value column.New Feature
✨ Evidence CLI
Develop Evidence Studio projects locally from the command line withevidence dev.View DocumentationBug Fix
🐛 Improve filter value visibility in the editor sidebar
Fixed an issue where filter values in the editor sidebar could be hard to read by showing each value on its own line.Bug Fix
🐛 Recent AI chats update instantly
Fixed an issue where new AI chats would not appear in Recent chats until the page was refreshed.Bug Fix
🐛 Improved spacing for small tables
Fixed an issue where tables with only a few rows could show unnecessary empty space.Improvement
🚀 Clearer error when defining queries inside components
Added a validation error when inline queries are defined inside components like tabs, accordion, or details. Queries should be defined at the top level of the page.Bug Fix
🐛 Accordion items now maintain their original order
Fixed an issue where accordion items could reorder themselves based on when they were last updated instead of their original document order.Bug Fix
🐛 Support for branch names with slashes in GitHub integration
Fixed an issue where branches containing slashes (e.g.,feature/my-branch) would break navigation across the editor, preview, published views, and PDF generation.Bug Fix
🐛 Button group and dropdown initial value fix
Fixed an issue where button groups and dropdowns could not set an initial value when using a numeric value column.Bug Fix
🐛 Fixed organization logo display in dark mode on published pages
Fixed an issue where the organization logo in the sidebar could appear as a dark image on a dark background when viewing published pages in dark mode.Improvement
🚀 Option to hide axis title arrow
Added atitle_arrow option to x_axis_options that lets you hide the arrow (→) on chart axis titles.Improvement
🚀 Demo data table references updated
Demo data tables have moved to thedemo schema (e.g. demo_daily_orders → demo.daily_orders). You may need to update references in existing projects and models.Bug Fix
🐛 Fixed model save failing after validation
Fixed an issue where saving a model could fail if the SQL query contained leading or trailing whitespace.Bug Fix
🐛 PDF downloads from editor now use working version
Fixed an issue where downloading a PDF from the editor would always produce the committed version instead of the current working draft.Bug Fix
🐛 Print group cards spacing fix
Fixed an issue where wrapping components in a print group with cards layout enabled would remove the spacing between cards.Bug Fix
🐛 Google Analytics setup links to Evidence docs
Fixed an issue where the Google Analytics connector setup page linked only to the Fivetran docs instead of the Evidence docs page.Improvement
🚀 More reliable PDF generation
Improved PDF generation reliability, especially for pages with conditionals, partials, and many components.Bug Fix
🐛 PDF downloads from preview now use working version
Fixed an issue where downloading a PDF from the preview route would always produce the published version instead of the working draft.Bug Fix
🐛 Fixed chart rendering error on published pages with point_title
Fixed an issue where charts using thepoint_title attribute could fail to render on published pages.Bug Fix
🐛 Fixed scatter chart tooltip with point_title and series
Fixed an issue where thepoint_title attribute on scatter charts was ignored in the tooltip when a series attribute was also set.Bug Fix
🐛 Fixed scatter chart size attribute
Fixed an issue where thesize attribute on scatter charts was ignored, causing all points to render at the same size.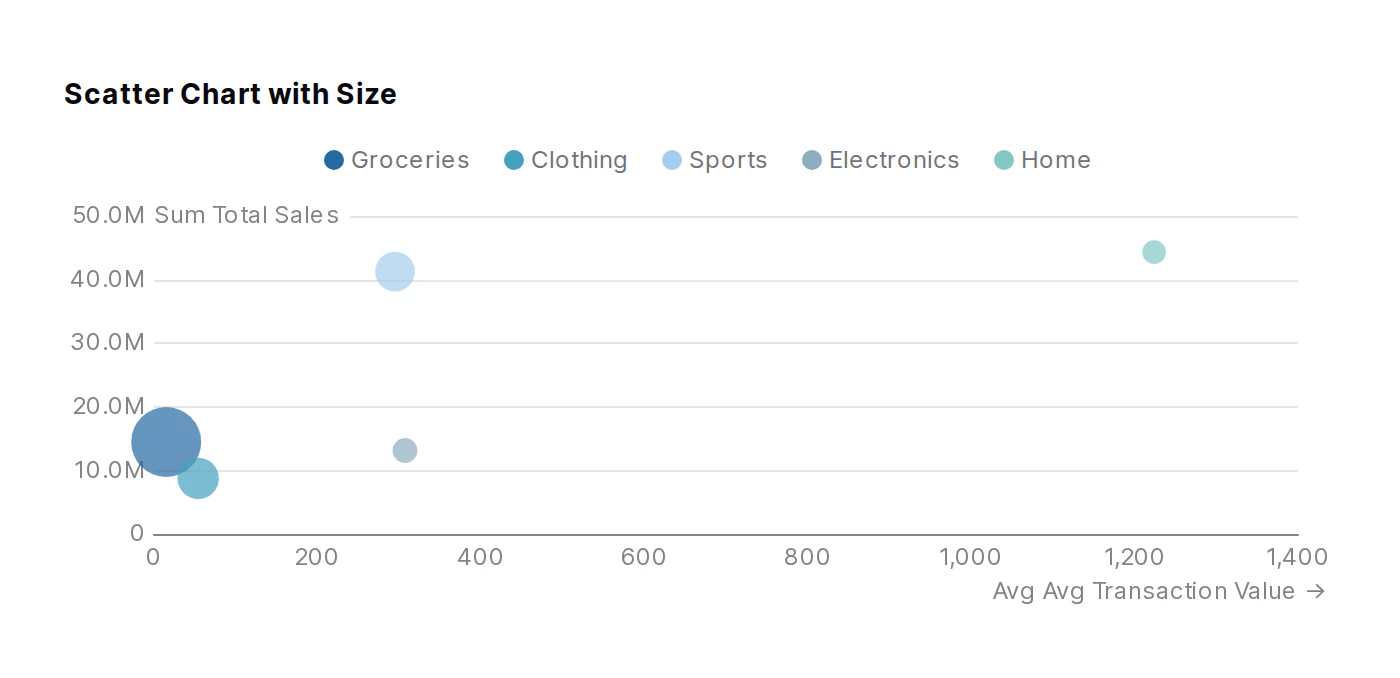
New Feature
✨ Date range support for map layers
Map layers (point_layer, area_layer, and heatmap_layer) now support thedate_range attribute for filtering data by time period.New Feature
✨ PayPal Connector
Connect your PayPal data to Evidence. Sync transactions, invoices, payments, subscriptions, and billing plans.View DocumentationImprovement
🚀 Connection string autofill for PostgreSQL connections
You can now paste a PostgreSQL connection string into any field when setting up a PostgreSQL connection, and all fields will be automatically filled in.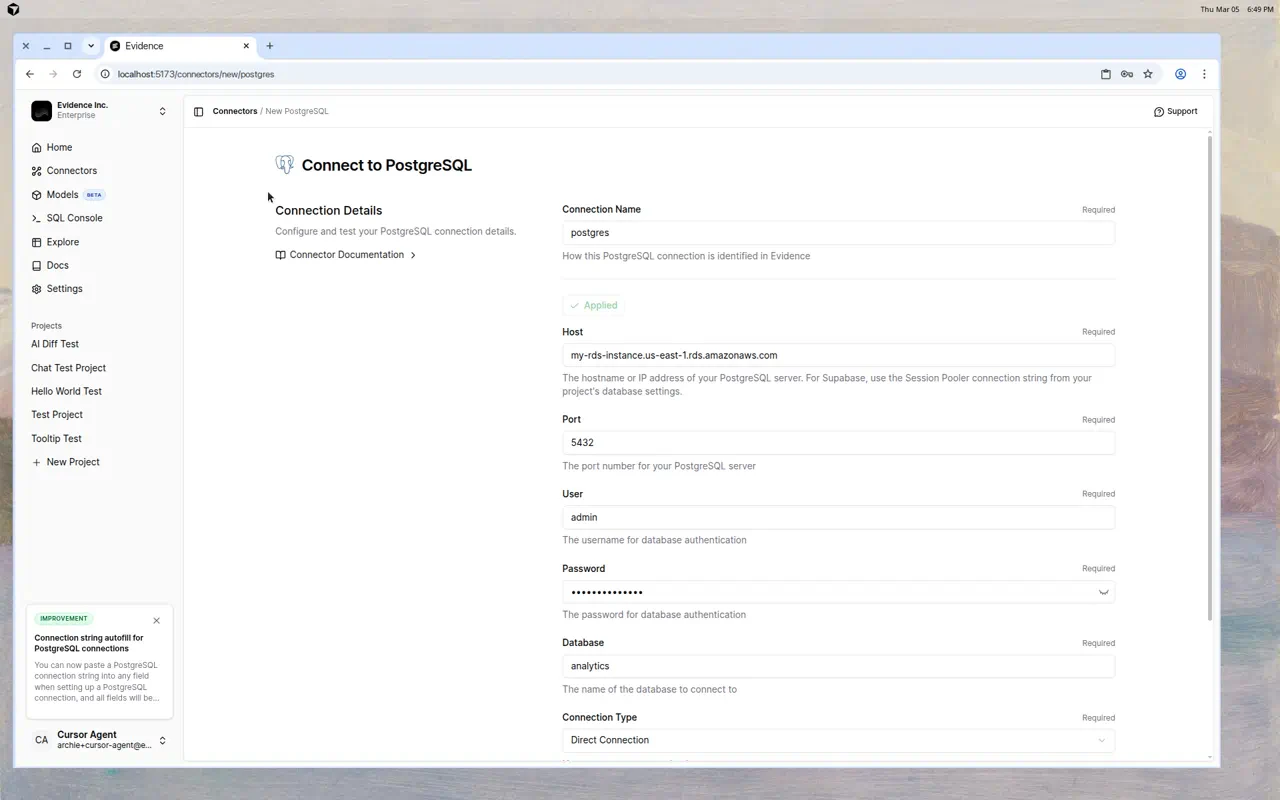
New Feature
✨ RevenueCat Connector
Connect your RevenueCat subscription data to Evidence. Sync subscribers, transactions, entitlements, offerings, and products.View DocumentationImprovement
🚀 Invite team members from the Share menu
Added a quick link to Team Settings from the Share menu so you can invite new team members while managing page or project access.Bug Fix
🐛 Fix for dimension grid with inline queries
Fixed an issue where the dimension grid component could not use inline SQL queries as its data source.Bug Fix
🐛 Fix legend color for lines with explicit color in combo charts
Fixed an issue where lines in combo charts with an explicit color option (e.g.,options={color="black"}) would display the palette color in the legend instead of the specified color.Improvement
🚀 Improved component search with keyword aliases
Added search keywords to component schemas so components can be found by common alternative names (e.g., “scatter plot” for scatter chart, “donut” for pie chart, “KPI” for big value).Bug Fix
🐛 Fix filters with multiple consecutive spaces in values
Fixed an issue where filter values containing multiple consecutive spaces would fail to match data correctly.Bug Fix
🐛 Fix collapsible table arrows not showing with hide_row_totals
Fixed an issue where collapsible table arrows were not visible when measures hadhide_row_totals enabled.Bug Fix
🐛 Fix branch deletion when branch was already deleted on GitHub
Fixed an issue where deleting branches from the Evidence UI would fail with an error when the branch had already been deleted on GitHub (e.g., by GitHub’s auto-delete on merge feature).New Feature
✨ Candlestick chart component
Added a new candlestick chart component for visualizing OHLC financial data with optional volume bars.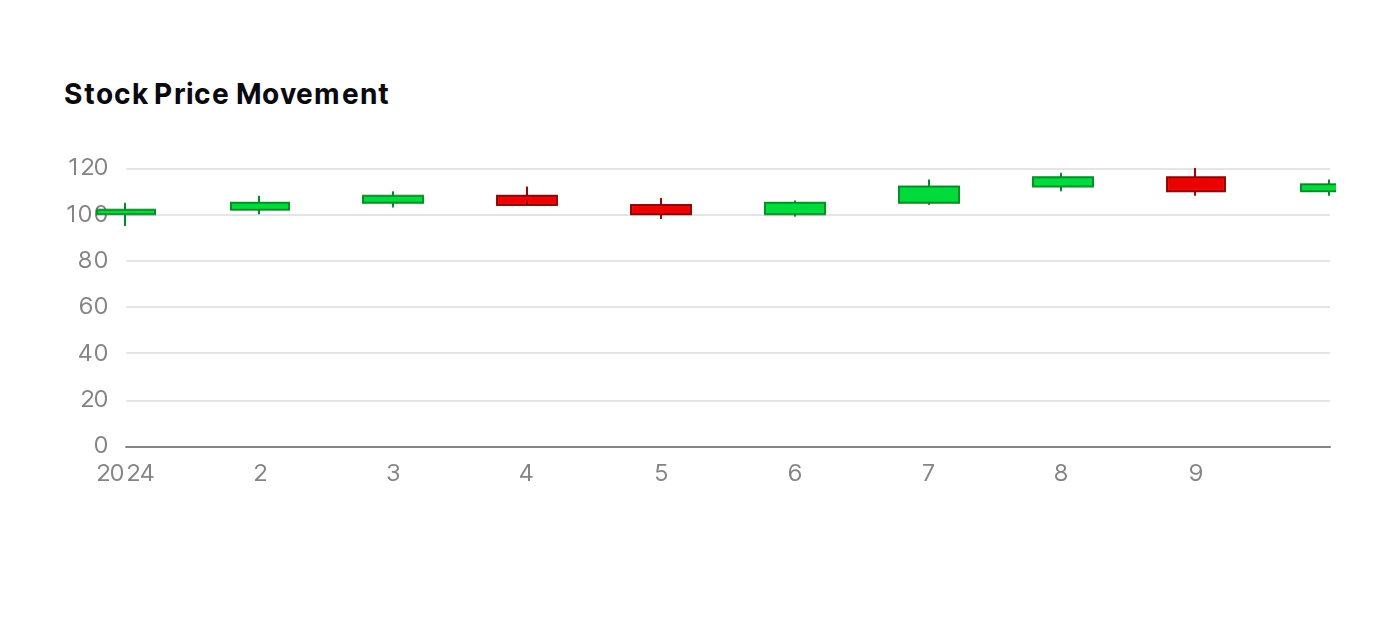
Bug Fix
🐛 Fix for overlapping content in PDF exports
Fixed an issue that could cause overlapping content in PDF exports.New Feature
✨ Percentage labels for pie charts
Addedpct and pct_fmt options for pie charts to display percentage values directly on slice labels.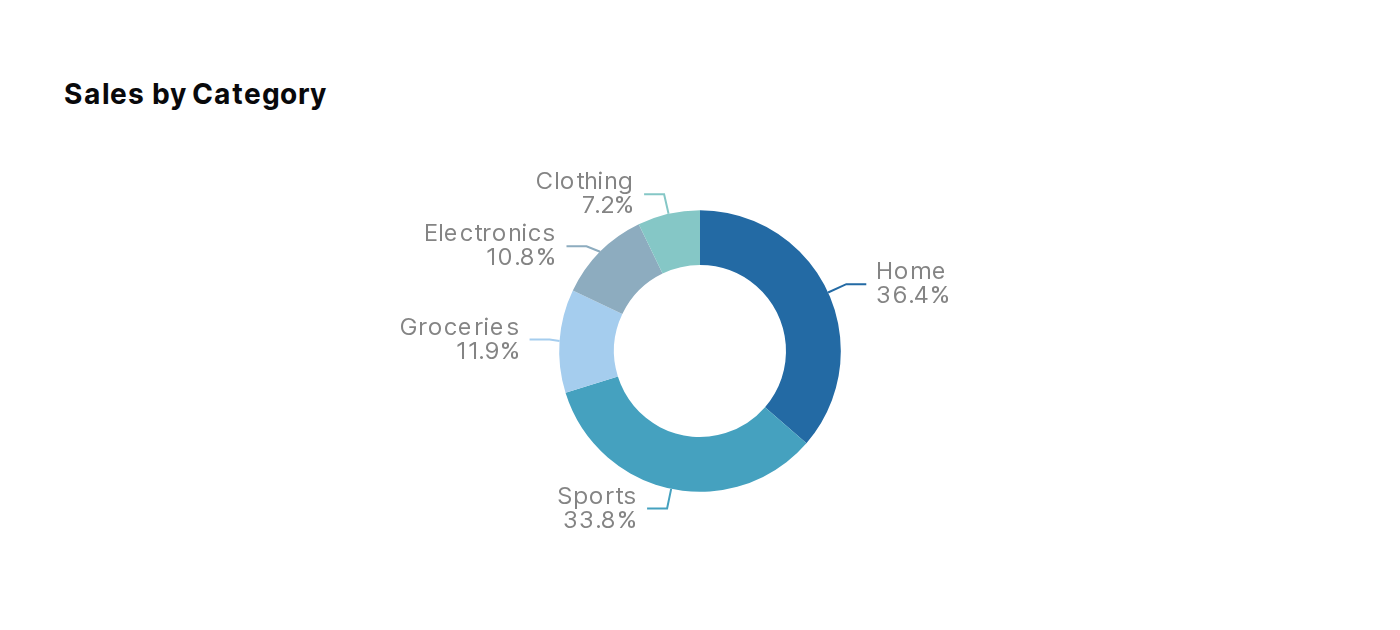
Bug Fix
🐛 Fix AI chat generating dropdowns and date range filters
Fixed an issue where AI chat could fail when generating dropdowns or date range filters.New Feature
✨ Salesforce Connector
Connect your Salesforce CRM data to Evidence. Sync accounts, contacts, opportunities, leads, and campaigns.View DocumentationBug Fix
🐛 Fix x_fmt not applying to chart tooltips
Fixed an issue where settingx_fmt on charts would format the axis labels but not the date value shown in the tooltip.Bug Fix
🐛 Improved AI chat reliability
Fixed an issue where AI chat could error out during longer conversations.New Feature
✨ Date Range Support for Input Components
Input components (dropdown, button_group, input_tabs, slider, dimension_grid) now support thedate_range attribute, allowing you to filter options by a specific time period or a range_calendar selection.Bug Fix
🐛 Fix dropdown with manual options showing SQL error
Fixed an issue where dropdowns using manual child option tags (nodata attribute) would show an “Unknown table function WHERE” error.New Feature
✨ Multiplayer editor now in beta
Multiplayer editor is now available in beta. Turn it on from Project Settings to collaborate with your team in real-time.Bug Fix
🐛 Graceful redirect when page not found after branch switch or rename
Fixed an issue where switching branches or renaming a page could result in a 404 when the current page doesn’t exist on the target branch or at the old URL.Bug Fix
🐛 Fix dimension link navigation resulting in 404
Fixed an issue where clicking dimension links in tables would result in a 404 when navigating between pages, because the URL wasn’t being resolved relative to the current project context.Bug Fix
🐛 Automatic chart padding for data labels
Charts now automatically add top padding when data labels are positioned above bars or points, preventing labels from being cut off at the top of the chart.New Feature
✨ External GitHub branch support and PR preview links
Projects connected to GitHub now show all repository branches in the branch switcher, not just branches created through Evidence Studio. When a pull request is opened or reopened, Evidence automatically posts a preview link comment on the PR.Improvement
🚀 SQL Console Table Grouping
Tables in the SQL console sidebar are now organized by schema/connection in a collapsible tree structure for easier navigation.New Feature
✨ Customizable Total Label for Tables
Tables now support atotal_label attribute that allows customizing the text displayed in total/subtotal rows and columns, useful when using non-sum aggregations like avg, min, max, or count.New Feature
✨ Editor Sidebar
Enhanced editor sidebar, with diff viewer, search, table schema, and page filters.Improvement
🚀 Pivot Table Performance
Significant performance improvements for pivoted tables and increased row/column limits.Bug Fix
🐛 Fix dropdowns closing modals
Fixed an issue where clicking on dropdown menus inside a modal would cause the modal to close unexpectedly.New Feature
✨ Gradient fill for area charts
Area charts now support a gradient fill option that fades from the series color at the top to transparent at the bottom. Enable it witharea_options={ gradient=true }.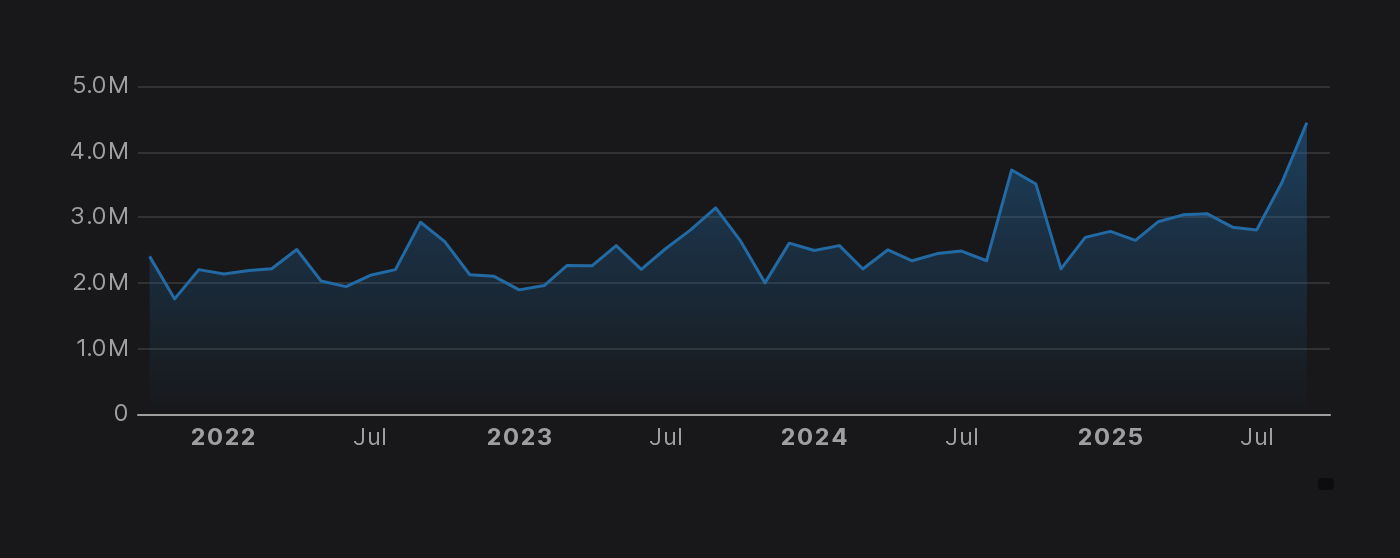
New Feature
✨ Clock Component
Display a live clock with running seconds and the current date using{% clock /%}. Supports 12h/24h format, monospace font variant, and left/right alignment.New Feature
✨ Branching
Work on multiple versions of your reports at the same time. Create and switch between branches, commit your work, and publish when you’re ready.New Feature
✨ Heat Grid
Visualize metrics across categories with color-coded cells based on configurable thresholds. Cells are colored red, yellow, or green depending on where values fall relative to your thresholds, with an optionallower_is_better mode.Improvement
🚀 Model Engine and Primary Key Settings
The model edit page now includes configurable refresh schedules, table engine selection, and primary key configuration with helpful tooltips explaining each engine type, data locations, and nullable primary key handling.View DocumentationNew Feature
✨ Progress Bars
Display progress toward goals with horizontal bars showing numerator/denominator ratios. Supports threshold-based coloring and custom color gradients.New Feature
✨ PDF Export Options
PDF export now supports custom orientation, margins, and card styling options.New Feature
✨ Datadog Connector
Connect your Datadog monitoring and analytics data to Evidence. Sync metrics, dashboards, monitors, hosts, and usage data from your Datadog account.View DocumentationNew Feature
✨ Custom Title for Table Filter
Customize the Table Filter button text using the newtitle attribute.New Feature
✨ Table Repeat Dimension Values
Tables and dimensions now support arepeat_values attribute that forces dimension values to display on every row instead of being collapsed.Improvement
🚀 Improved code editor font
The code editor now uses Geist Mono, a modern monospace font designed for better readability and aesthetics.New Feature
✨ Custom AI Instructions
Configure custom instructions for the AI assistant in Settings > AI Agent.New Feature
✨ RDS PostgreSQL Connector
Connect your RDS PostgreSQL database to Evidence and sync your data automatically.View DocumentationImprovement
🚀 PostgreSQL TLS Requirement Documentation
Added documentation note for PostgreSQL and Azure PostgreSQL connectors specifying that TLS/SSL must be enabled on the database for secure connections.New Feature
✨ Collapsible Tables
Tables with subtotals can now be collapsed. Click subtotal rows to expand or collapse their children.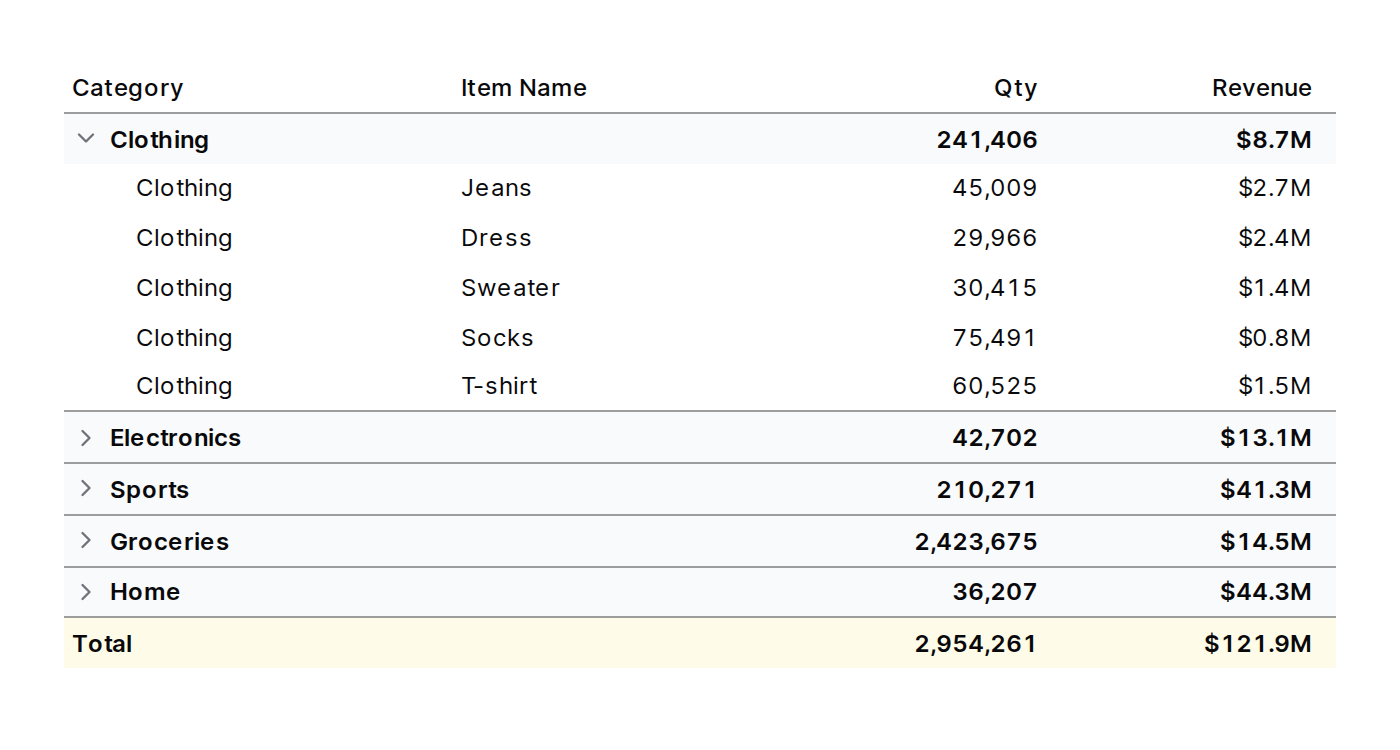
Bug Fix
🐛 Fixed row link chevron styling for total and subtotal rows
Fixed chevron column styling in tables with row links to match total/subtotal row backgrounds.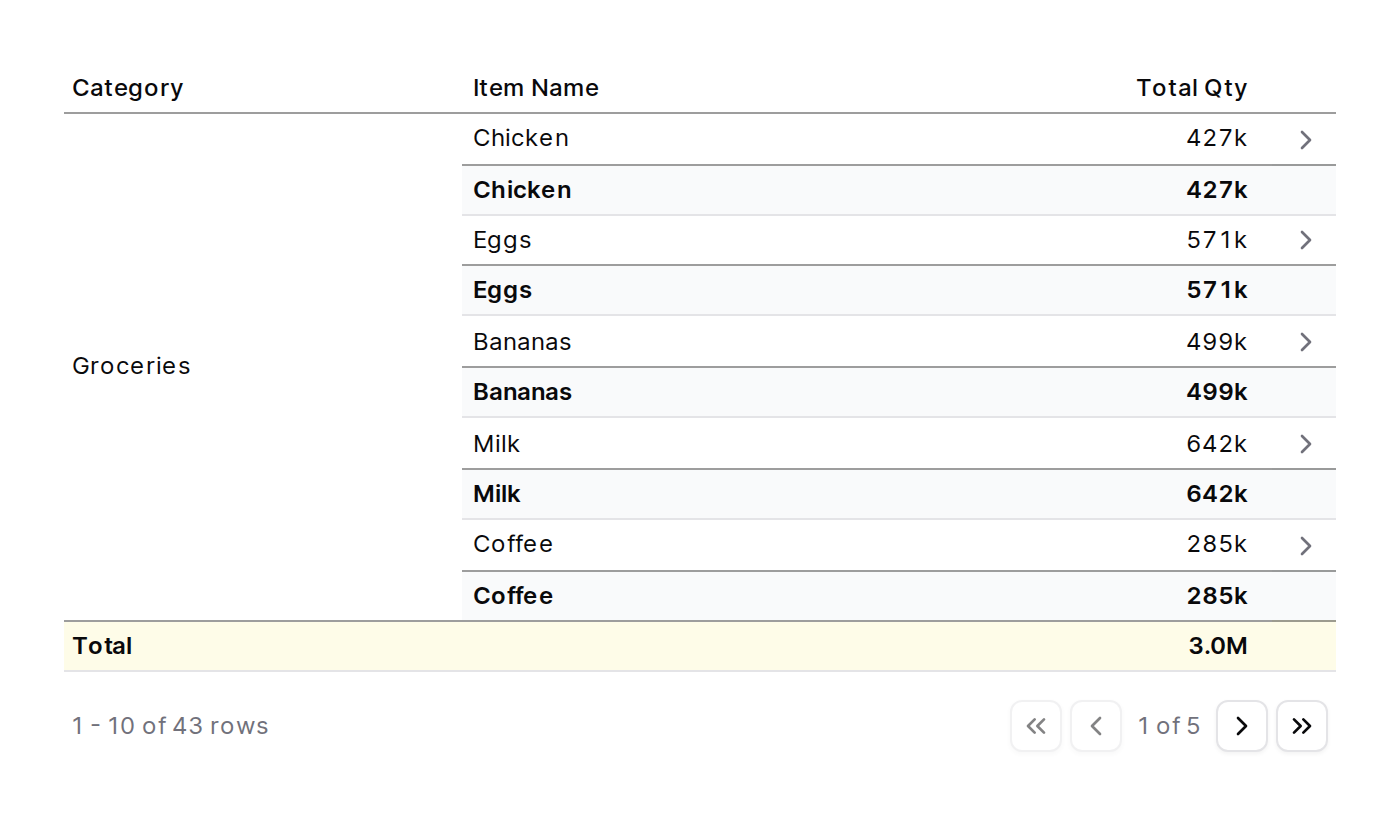
New Feature
✨ Total and Subtotal Position
Control where totals and subtotals appear withtotal_position and subtotal_position. Set to “top” or “bottom”.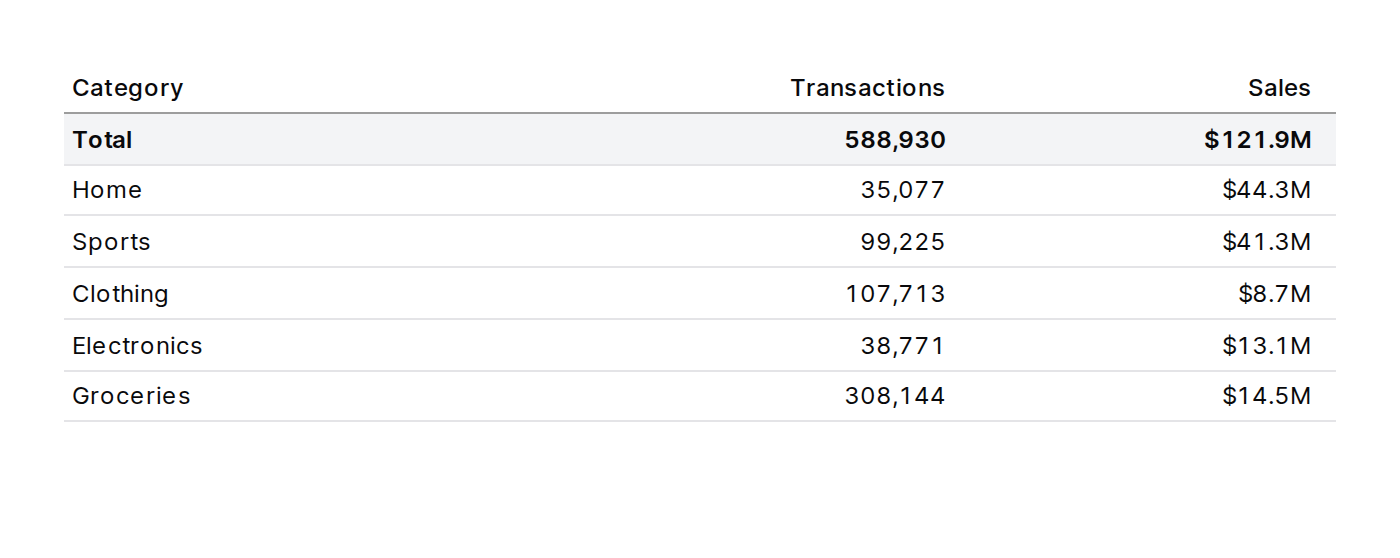
Improvement
🚀 Table Filter Initial Values and Required Selections
Table filters now supportinitial_values to set default filter values when the page loads, and require_selection to prevent specific filters from being cleared.Improvement
🚀 Automatic Unit Formatting for Numbers
BigValue, Value, and Table components now auto-format large numbers with compact units (e.g., $1.2M instead of $1,234,567)New Feature
✨ Text Size Option for Big Value
Thebig_value component now supports a text_size attribute with predefined options (sm, base, lg, xl, 2xl, 3xl, 4xl, 5xl) for reliable text sizing.Improvement
🚀 Clear Table Sorting with Third Click
Click a column header a third time to clear sorting and return to the original order.View DocumentationNew Feature
✨ Azure SQL Database Connector
Sync data from Azure SQL Database directly into Evidence.View DocumentationNew Feature
✨ Logo Attribute for Table Dimensions
Display company logos in table dimension columns. The newlogo attribute accepts a column containing domains to look up logos, and logo_options lets you customize size, grayscale mode, and label visibility.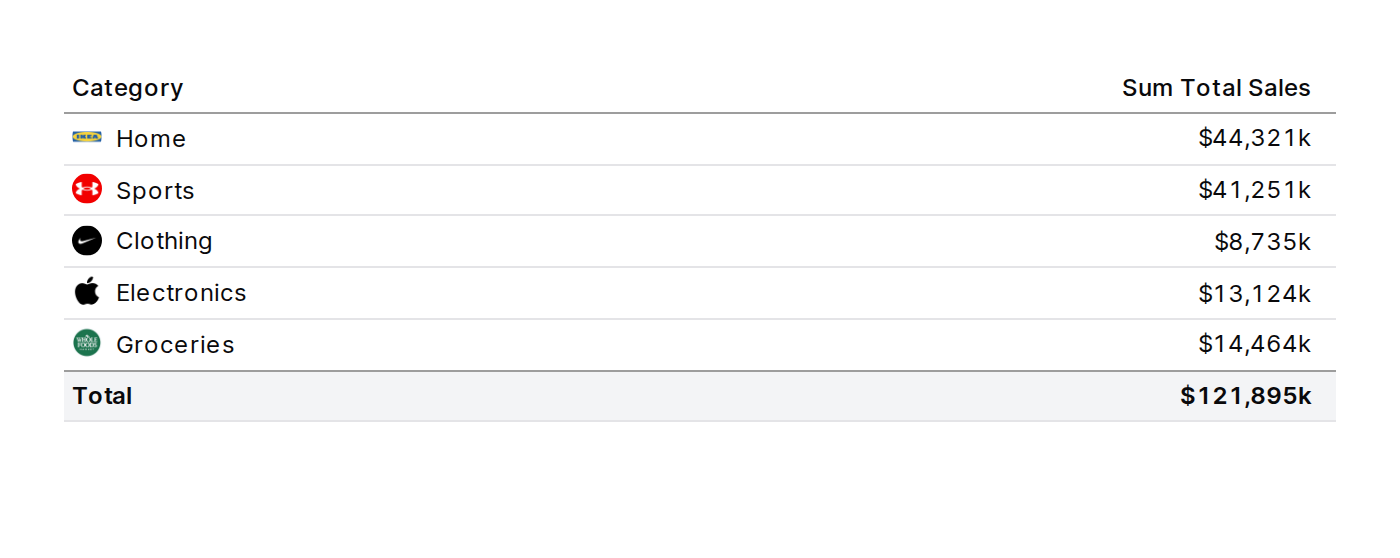
New Feature
✨ PDF Export for Viewers
Viewers can now download published pages as PDFs using the page menu or the keyboard shortcut (Cmd/Ctrl+P).New Feature
✨ Twilio Connector
Connect your Twilio data to Evidence. Sync calls, messages, accounts, and usage records.View DocumentationImprovement
🚀 BigQuery 1 Minute Incremental Syncs
BigQuery data connector now supports 1 minute incremental syncs for faster data freshness.View DocumentationNew Feature
✨ Column Groups in Tables
Group related columns under shared headers using the newcolumn_group attribute on measures and dimensions. Useful for organizing metrics by category, such as revenue metrics vs volume metrics.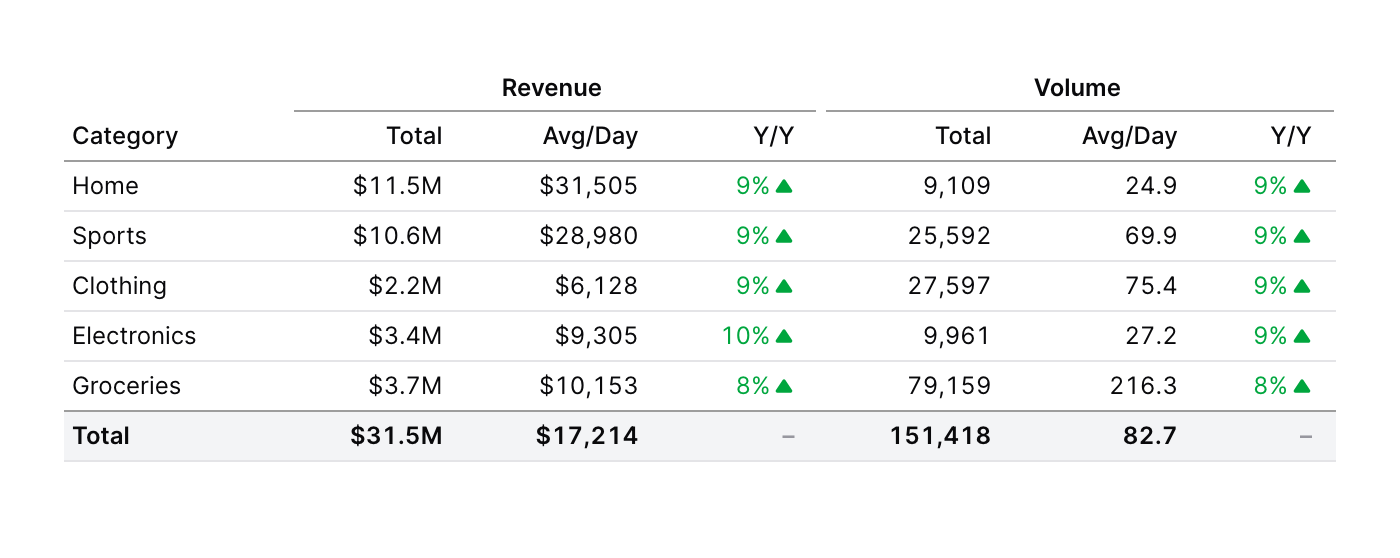
Bug Fix
🐛 Dark Mode Empty Circle Markers Fix
Fixed emptyCircle markers in charts to properly use the background color in dark mode instead of white.New Feature
New Feature
✨ Google Ads & Facebook Ads Connectors
Connect your Google Ads and Facebook Ads data to Evidence. Sync campaigns, ad groups, ads, and performance metrics to build marketing analytics dashboards.View DocumentationBug Fix
🐛 Horizontal Bar Chart Sorting Fix
Horizontal bar charts now default to sorting by value descending, showing the largest values at the top instead of the bottom.New Feature
✨ Logo Component
New logo component to display company logos using logo.dev. Supports light/dark theme switching, configurable sizes, and grayscale mode.New Feature
New Feature
✨ PostHog Connector
Connect your PostHog product analytics data to Evidence. Sync events, persons, cohorts, feature flags, insights, and more from your PostHog account.View DocumentationImprovement
🚀 Snowflake 1 Minute Incremental Syncs
Snowflake data connector now supports 1 minute incremental syncs for faster data freshness.View DocumentationNew Feature
New Feature
✨ Dimension Grid
Newdimension_grid component for interactive multi-dimensional filtering.Bug Fix
🐛 Fix for frozen columns row shading
Frozen columns in tables now display the correct alternating row shading whenrow_shading=true is enabled. Previously, frozen columns would not show the shading because they had a solid background that overrode the row-level shading.New Feature
✨ Series colors for pie charts
Map specific category values to specific colors in pie charts using theseries_colors option in chart_options. This ensures consistent, meaningful coloring regardless of which categories are present in the data.Bug Fix
🐛 Export Data Retains Filters
Table exports now correctly include filtered and sorted data, matching the visual display on screen.Bug Fix
🐛 PDF Export Now Retains Filters
When downloading a PDF, any selected filter values are now preserved in the exported PDF.ImprovementBreaking Change
🚀 Adjusted Developer Role Privileges
Previously, developers and admins could manage users, groups and customers. This is now restricted to Admins only.New Feature
✨ Motherduck Connector Schema Support
You can now use schema with the Motherduck connectorBug Fix
🐛 Dropdown Component Now Supports ‘where’ Attribute
Thedropdown component now supports the where attribute for filtering dropdown options with custom SQL WHERE conditions, bringing it to feature parity with other filter components like button_group and input_tabs.Bug Fix
🐛 Horizontal Bar Chart X-Axis Formatting
Fixed issue where thex_fmt parameter was not being applied to axis labels in horizontal bar charts. Formatting now works consistently for both axis labels and tooltips.New Feature
✨ Deltalake (S3) Connector
Connect using your S3 with Delta Lake format your data remains at rest in your S3 bucket.New Feature
✨ Smooth Line Option
Newsmooth attribute inside line options lets you create a line with rounded corners View Documentation
New Feature
✨ Chart height attribute
Control the height of your charts using the height attributeView DocumentationNew Feature
✨ Customer Groups
Create customers, and invite customer users to view reports that you choose. View Documentation
New Feature
Improvement
🚀 Improved Excel Export
Excel exports now use component titles to create tab names, and exclude logic and filter componentsNew Feature
✨ User Variables
Access the user’s name, email and organization using variables in markdown.View DocumentationNew Feature
✨ Themes
Set color themes at the organization, project, and page level - including background, chart, and card colorsAccess theme settings in page settings, project settings, or org settings. You can override theme colors at each level (e.g., project can override org theme, page overrides project and org themes)Improvement
🚀 Improved Translation Validation Errors
Incorrect structures for translation maps will provide useful errorsImprovement
New Feature
✨ Translation Management
Define variables with different translations for multi-language apps. View Documentation
New FeatureBreaking Change
✨ Standalone Horizontal Bar Chart Component
New dedicatedhorizontal_bar_chart component makes it easier to create horizontal bar chartsWe recommend migrating any existing horizontal bar charts to this new componentView DocumentationNew Feature
✨ Display control for total and subtotals in table
Choose which totals or subtotals to display in your tableView DocumentationNew Feature
✨ Dark Mode Chart Colors
Configure colors for both light and dark mode in your project and org settings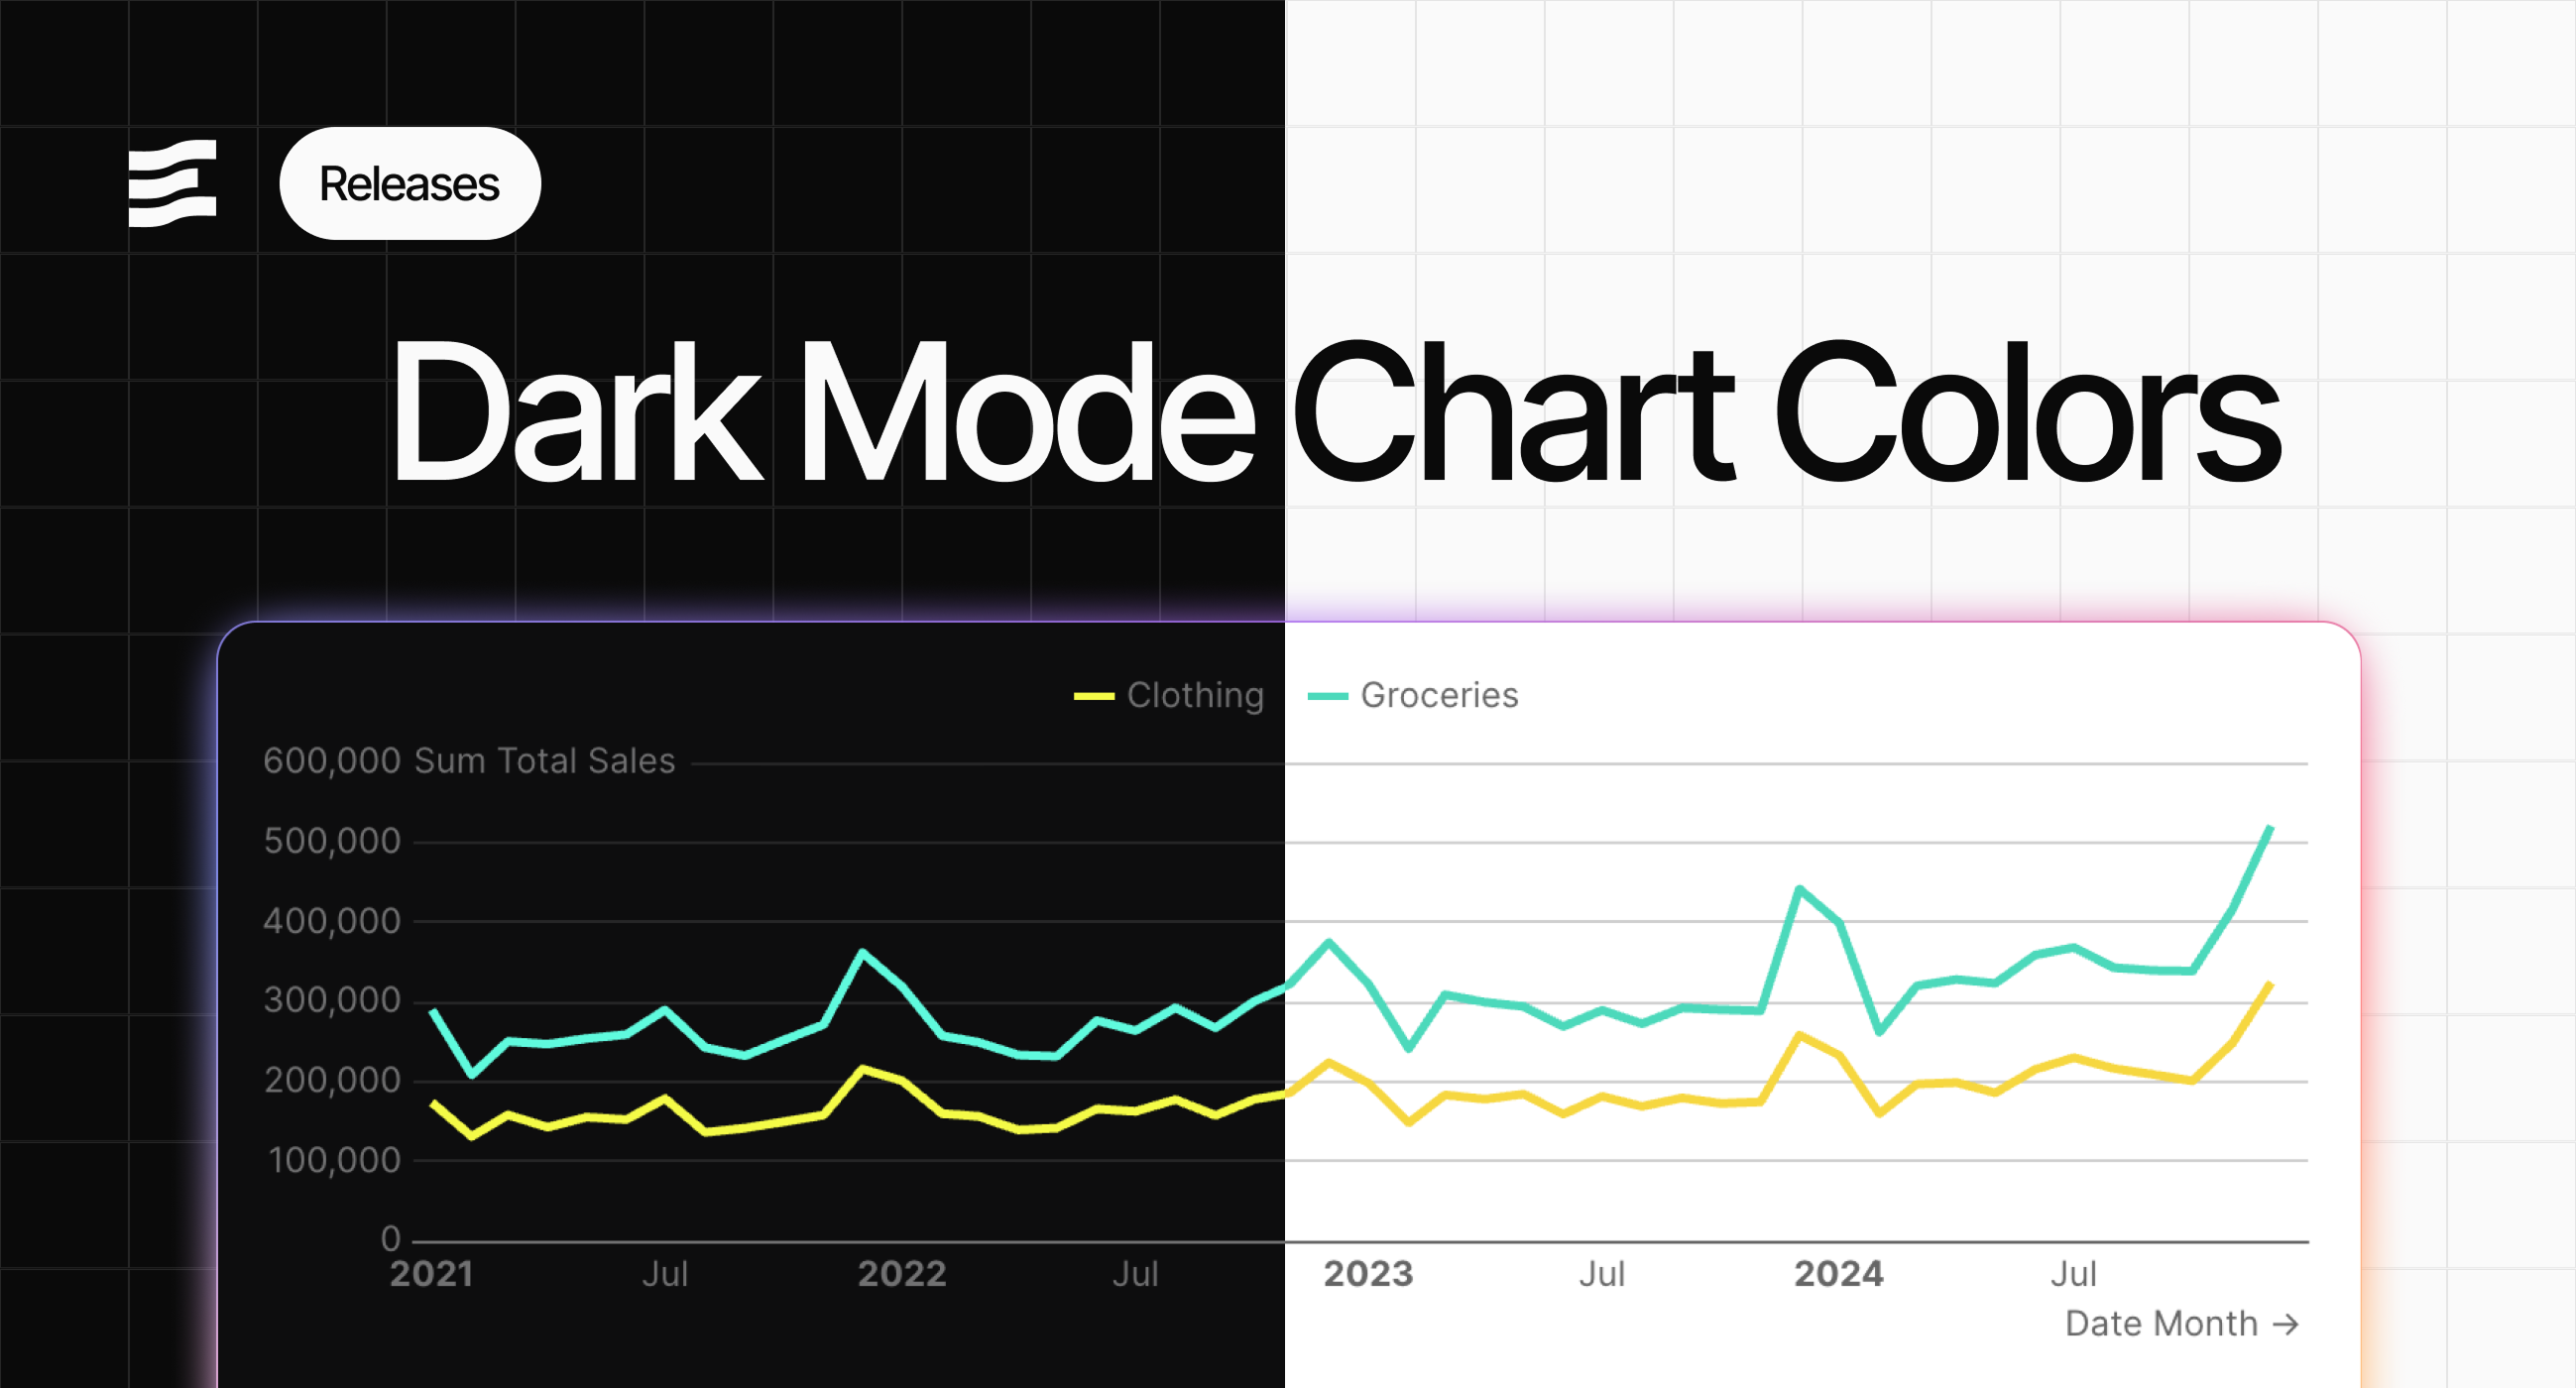
New Feature
✨ Input tabs full_width and align attributes
Input tabs now allows the same styling configuration as the Tabs component, including full width and right alignView Documentation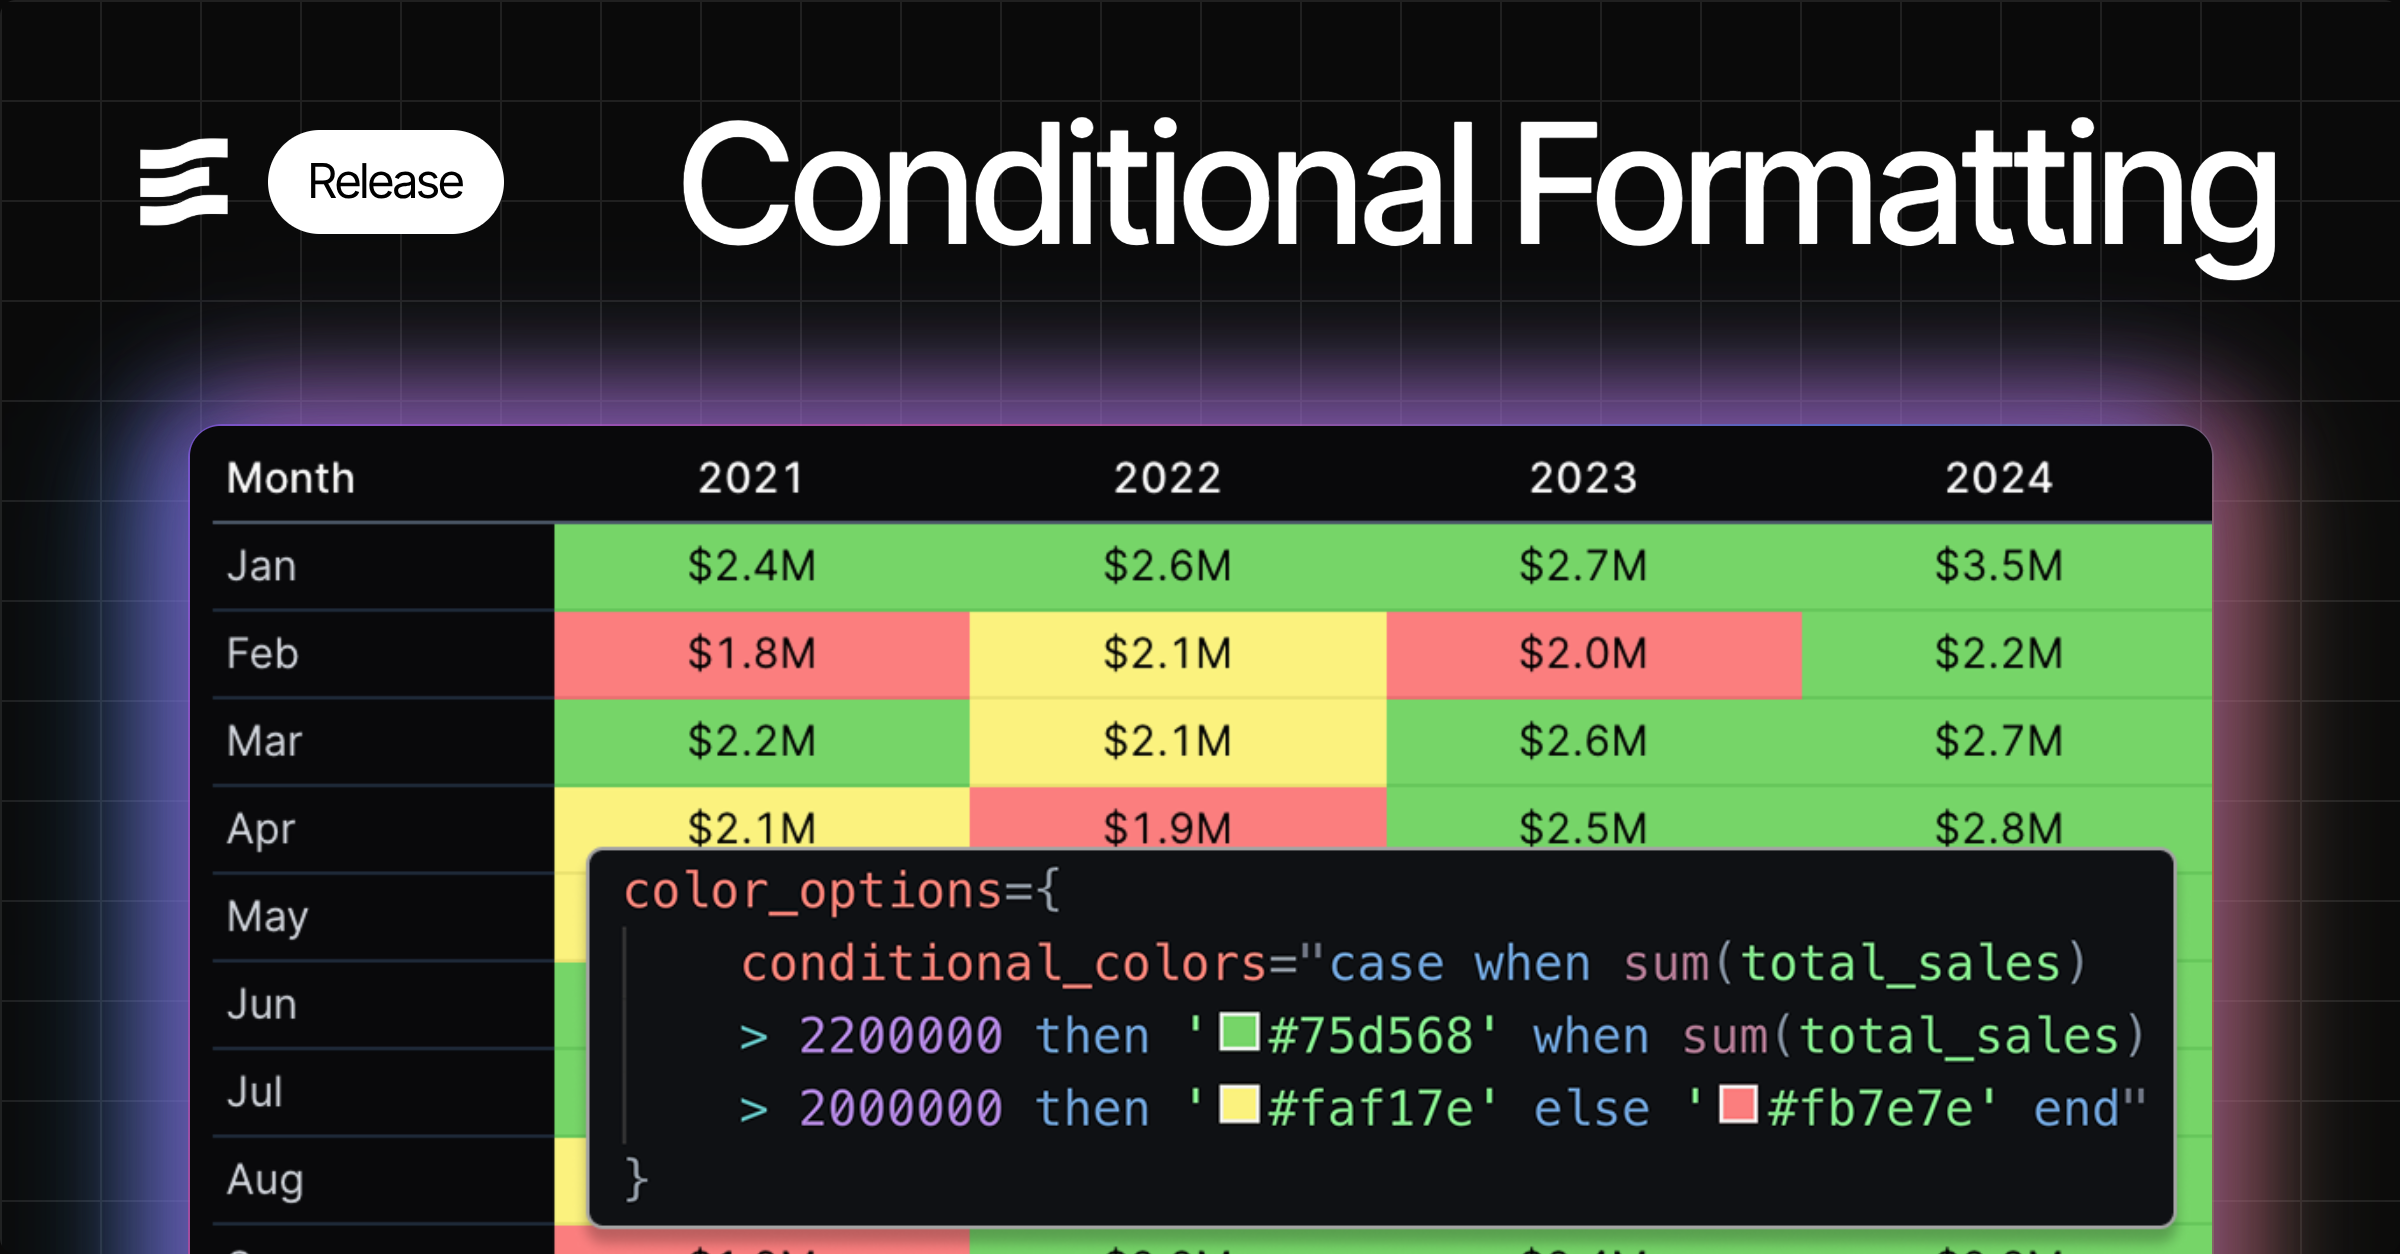
New Feature
Improvement
🚀 Assign access to pending users
You can now grant project and page access to users who have not yet accepted invitations to join the Evidence organization.Improvement
🚀 Control order of series in combo chart
Combo chart now displays your series in the order you define them in your markdown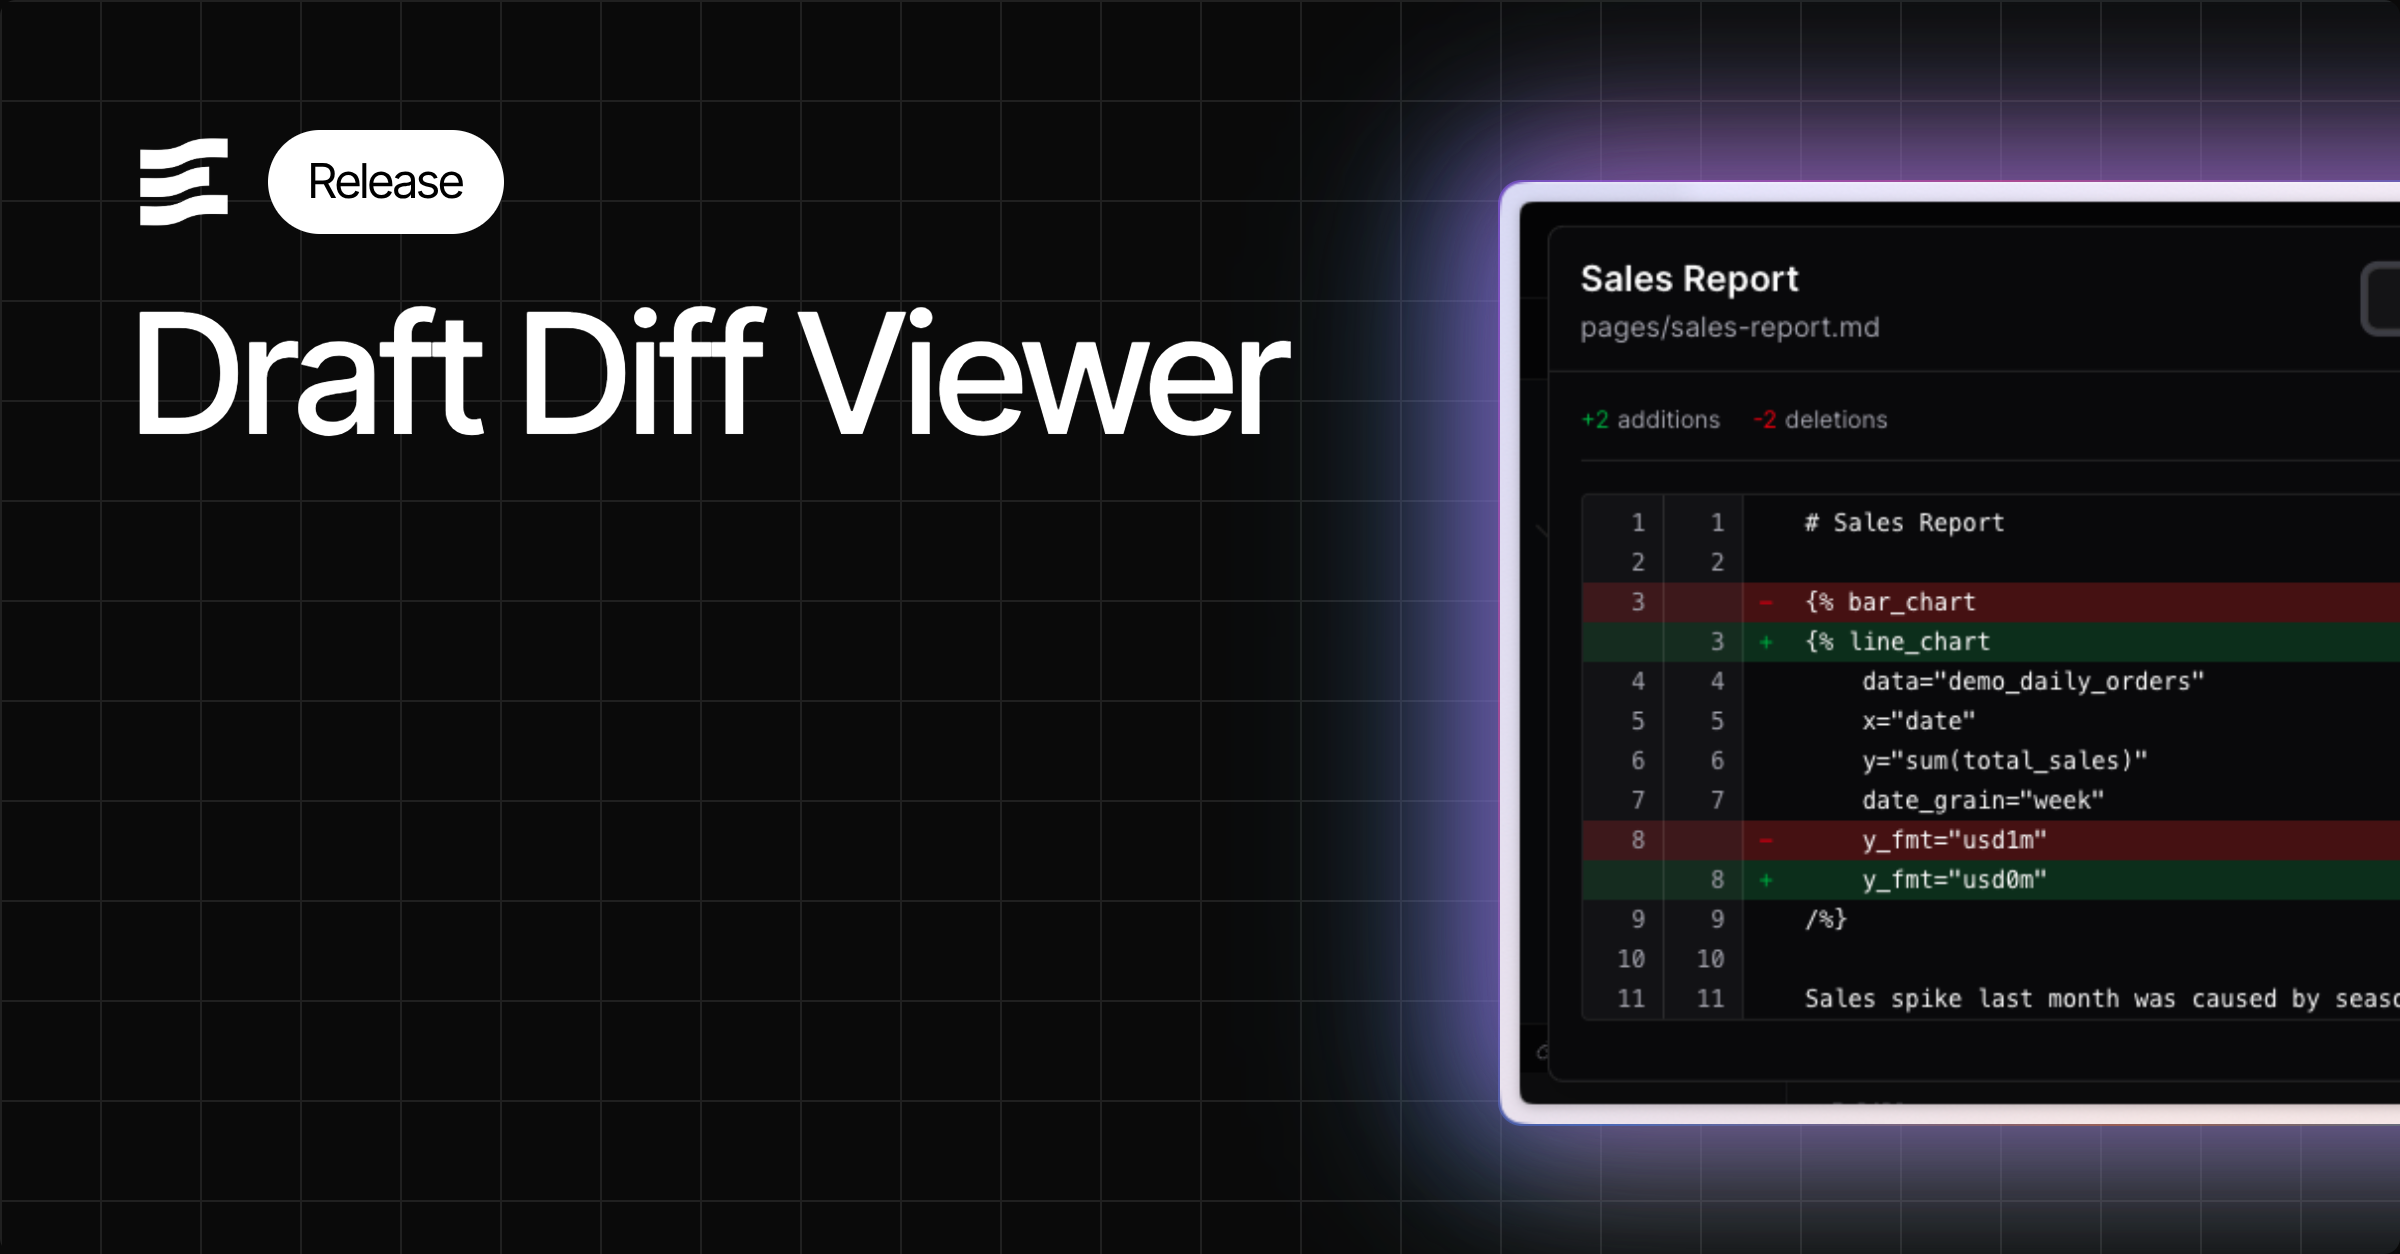
Improvement
🚀 Icons in Autocomplete
Find components more easily in component autocomplete menus using the mini-icons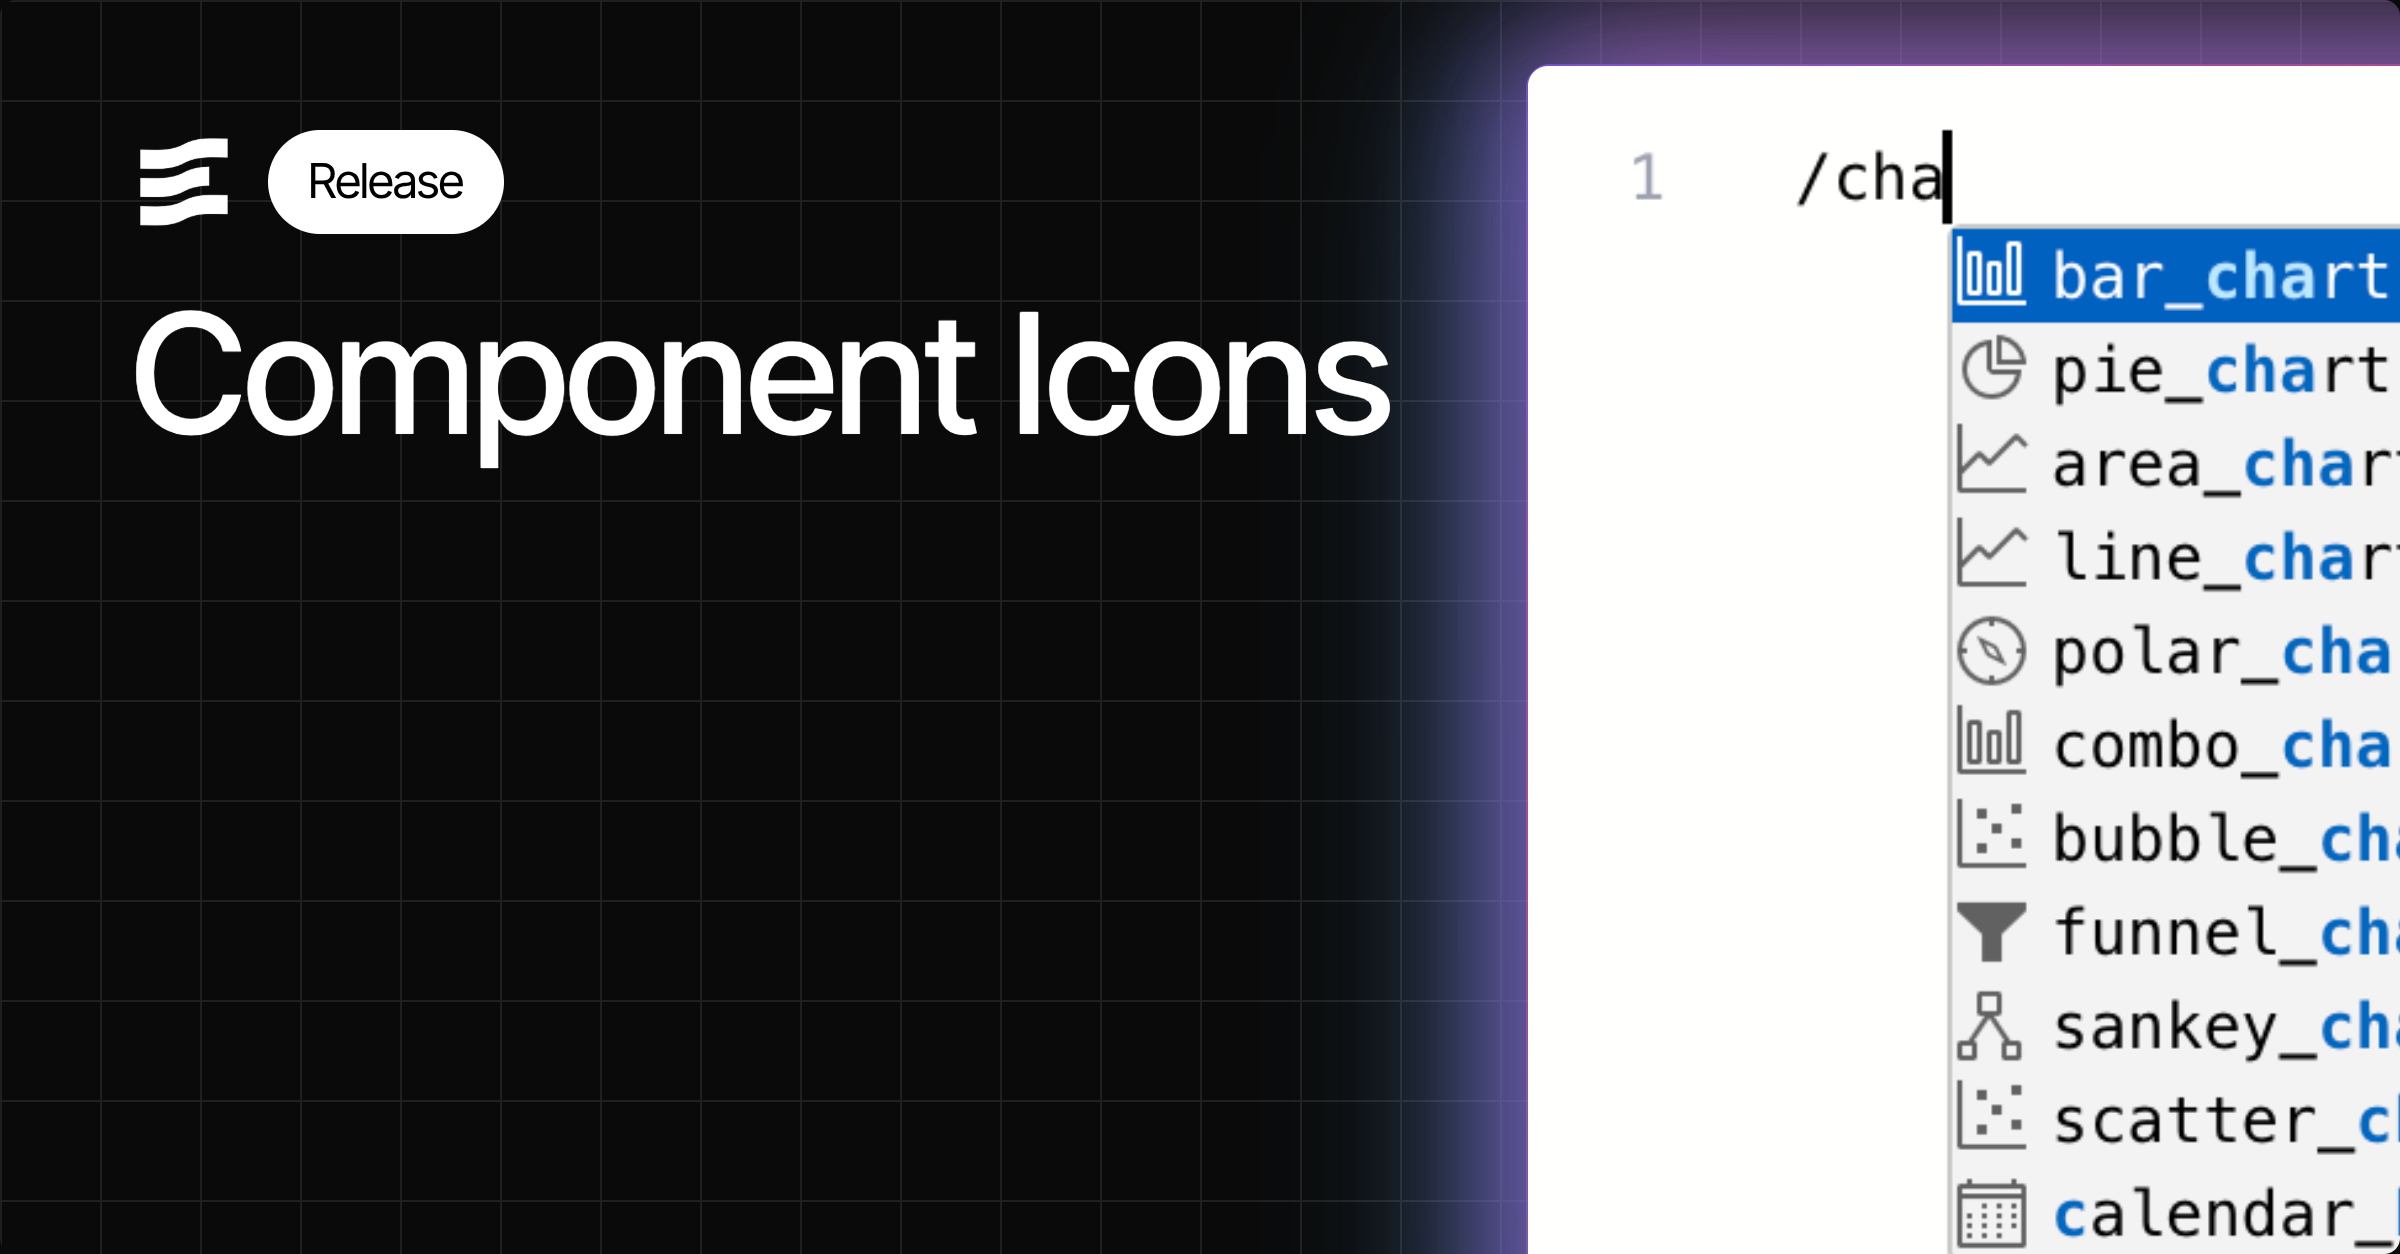
Improvement
🚀 Smoother chart loads on input changes
Improved chart loading behaviour and animation when changing inputs on your page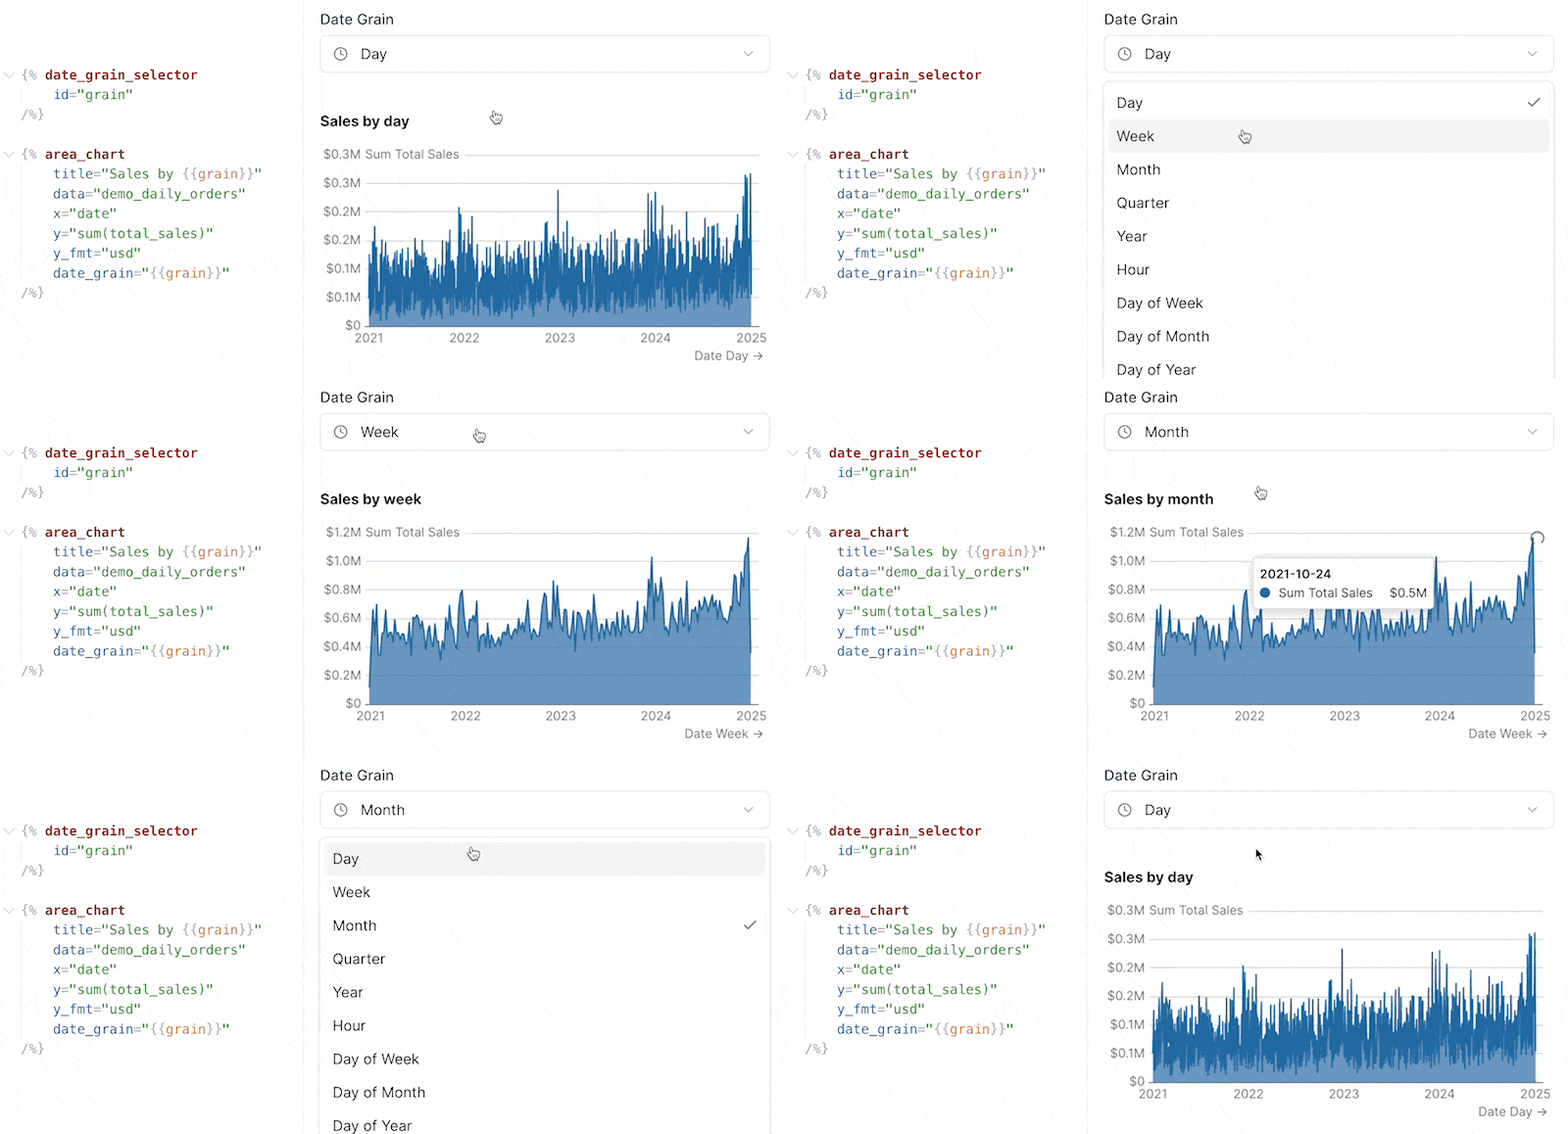
Bug Fix
🐛 Fix for table pivoting issues
Fixed issue where tables were not pivoting in certain situationsNew Feature
✨ fmt property for input options
Use dynamic formats in viz components when creating an input to select a metric - e.g., show ‘usd’ for sales or ‘pct1’ for growthView DocumentationNew Feature
✨ Variable label property
You can now reference the label property of a variable - useful when adding labels to viz components based on input selectionView DocumentationBug Fix
🐛 Fix for custom date range end dates
Fixes issue where custom end date defined in SQL was not taking effectBug Fix
🐛 Fix for scale_column
Fixes issue where scale_column in the measure component was not properly assigning colorsImprovement
🚀 Improved handling of date grains in charts
Automatically handles formatting and positioning of labels on x-axis for date grains including month of year and day of weekNew Feature
✨ Table of Contents
A generated table of contents from the headings in your report. Enable from page settings.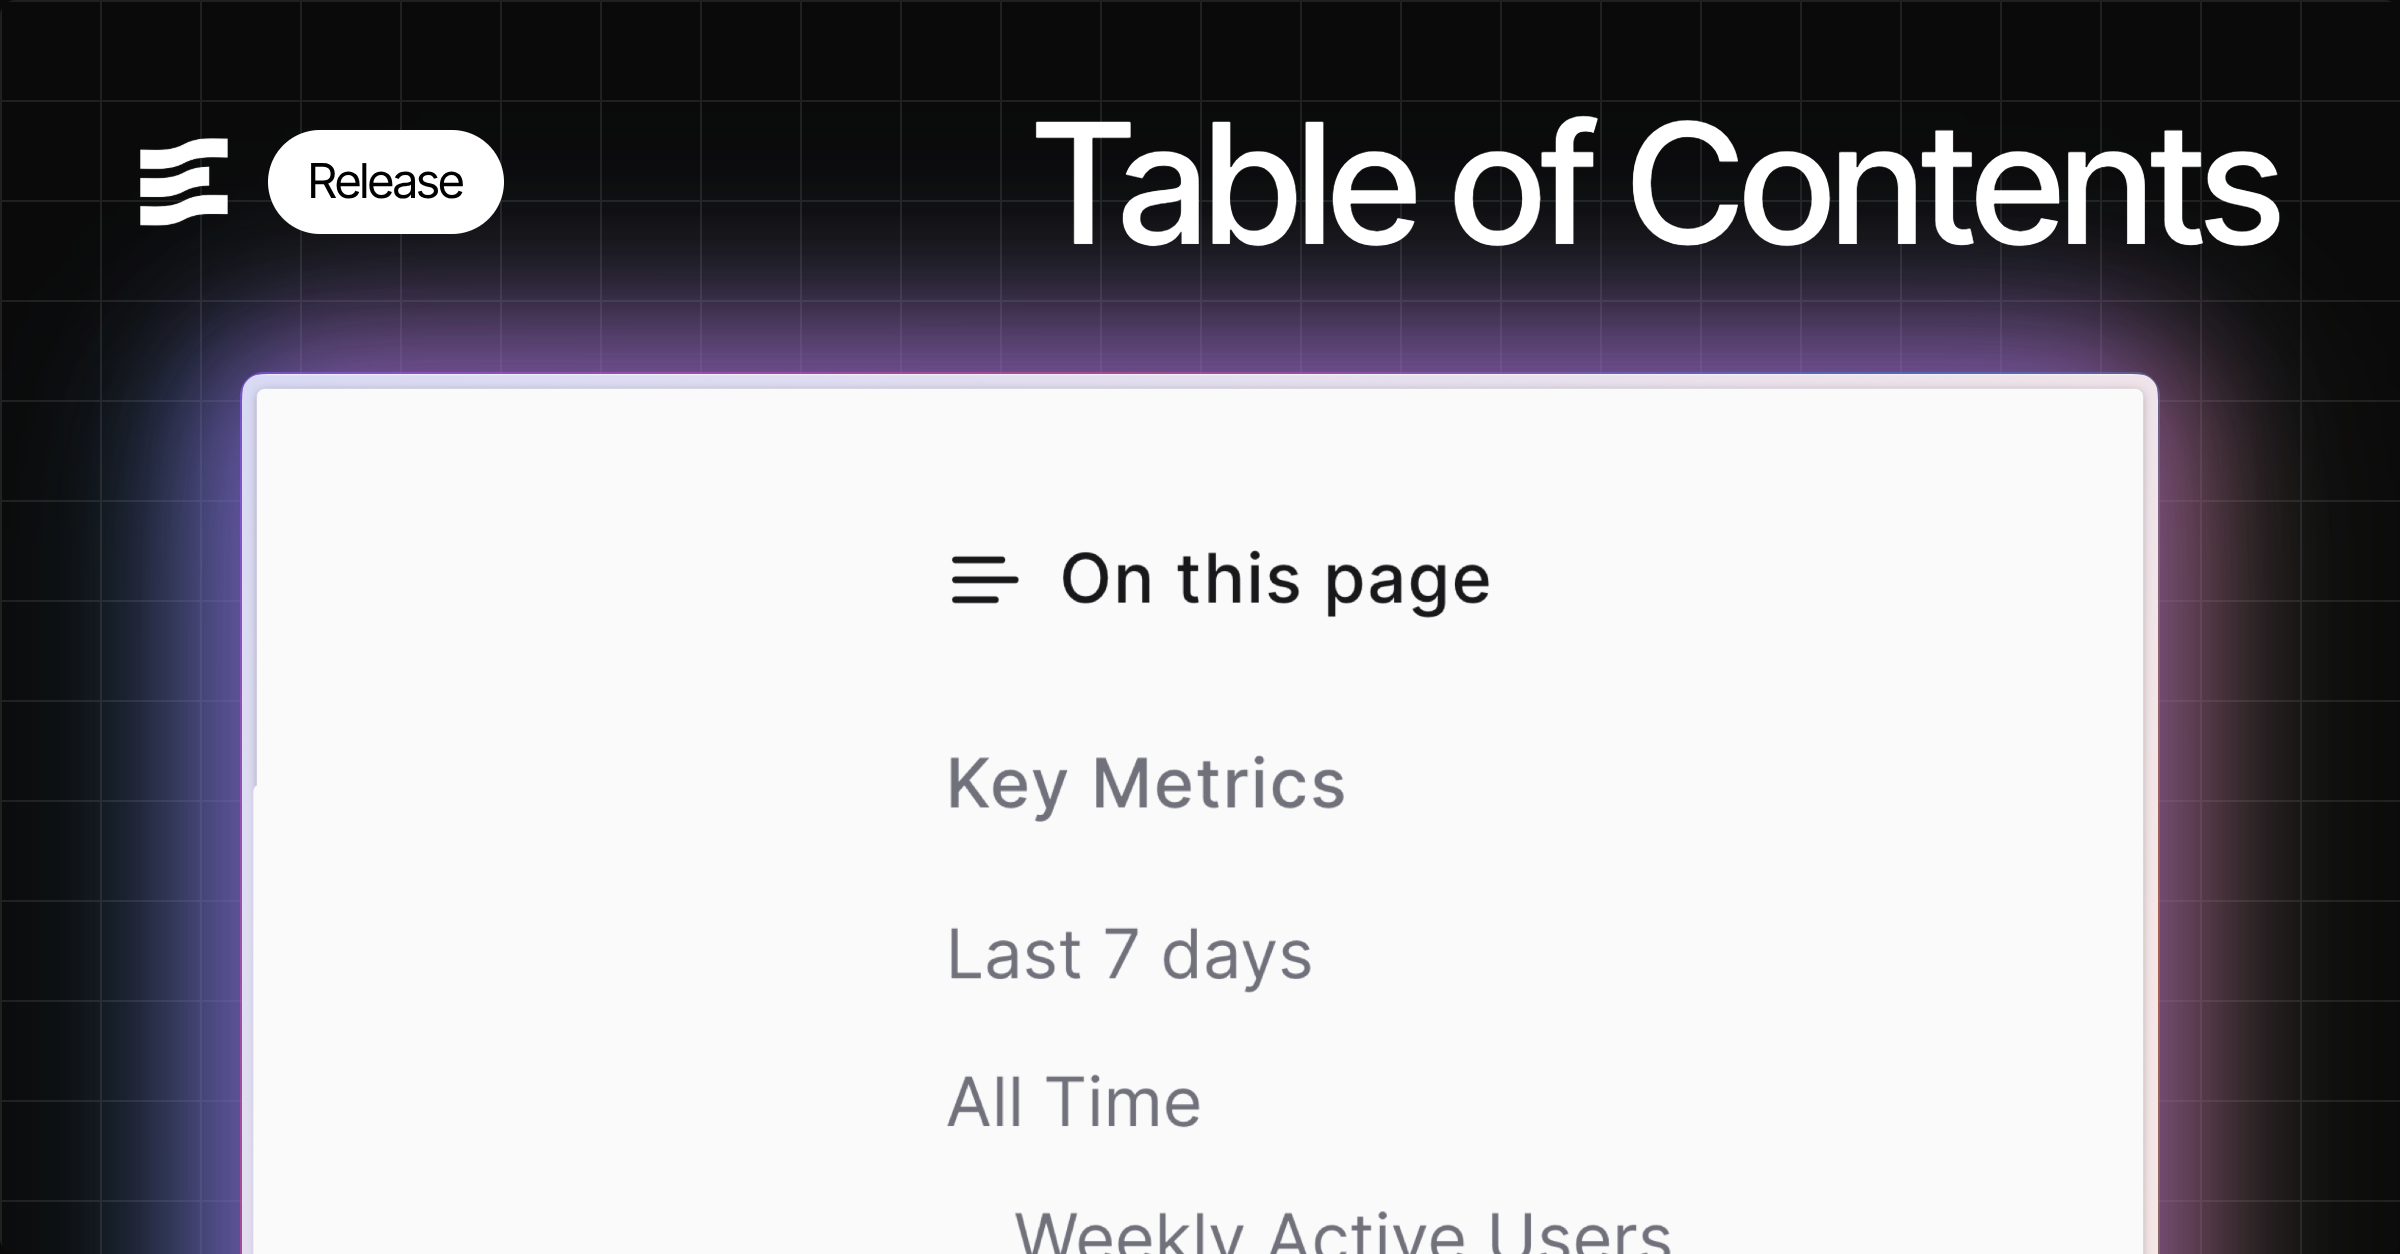
New Feature
✨ Top padding option for charts
Top padding override option to allow more room for data labels - helps in cases where labels are cut offNew Feature
✨ x_sort attribute
Choose a specific sort order for your x-axis, including specifying explicit stringsBug Fix
🐛 Histogram support for inline queries
Fix for Histogram issue where it could not accept inline queriesImprovement
🚀 Toggle invert attribute
Invert attribute added to make toggled state = false instead of trueNew Feature
New Feature
✨ Query timing metadata
Queries in the SQL Console, and the pop out component inspector at the bottom of the editor now display how long the query took to run in the Evidence query engine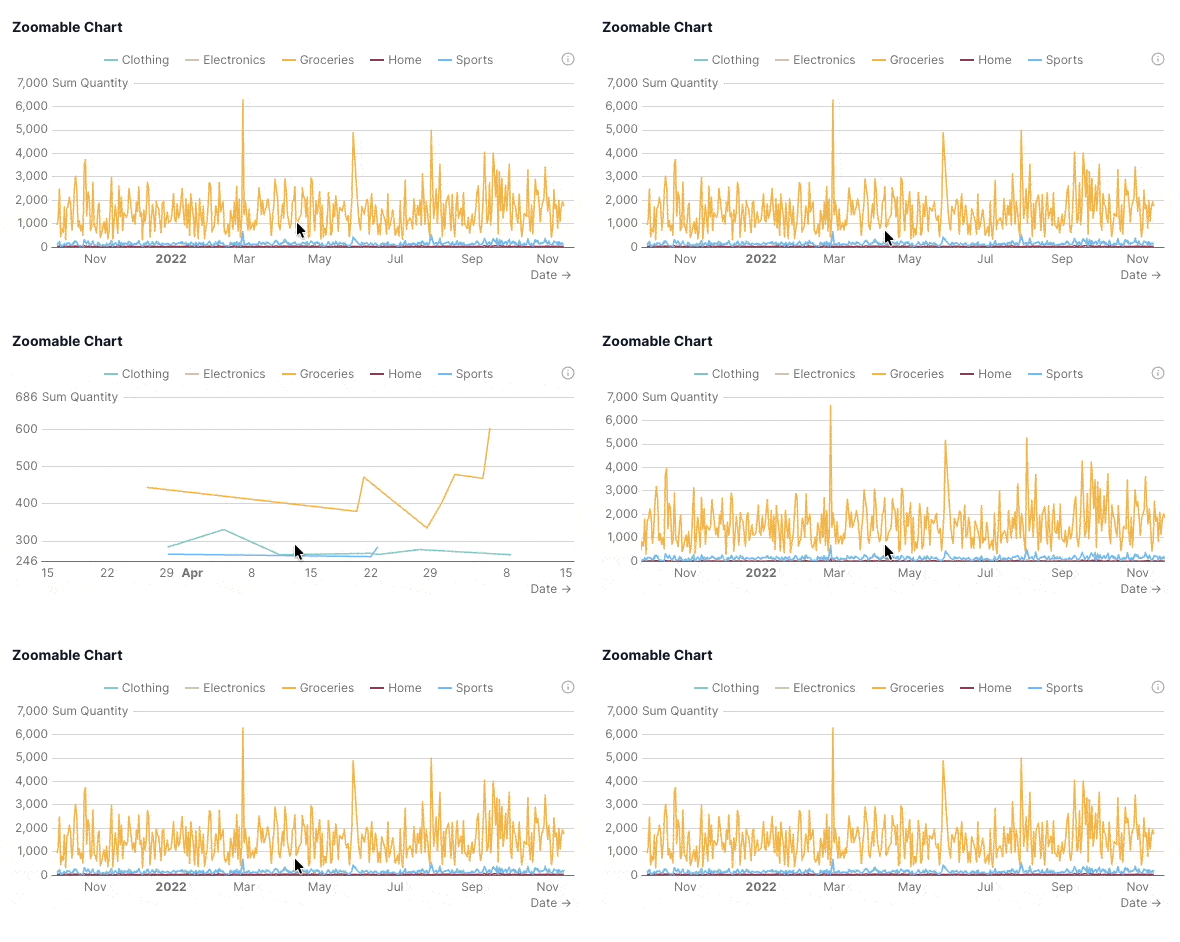
New Feature
✨ Toggle input
New toggle input component which sets a boolean variable you can use in queries and components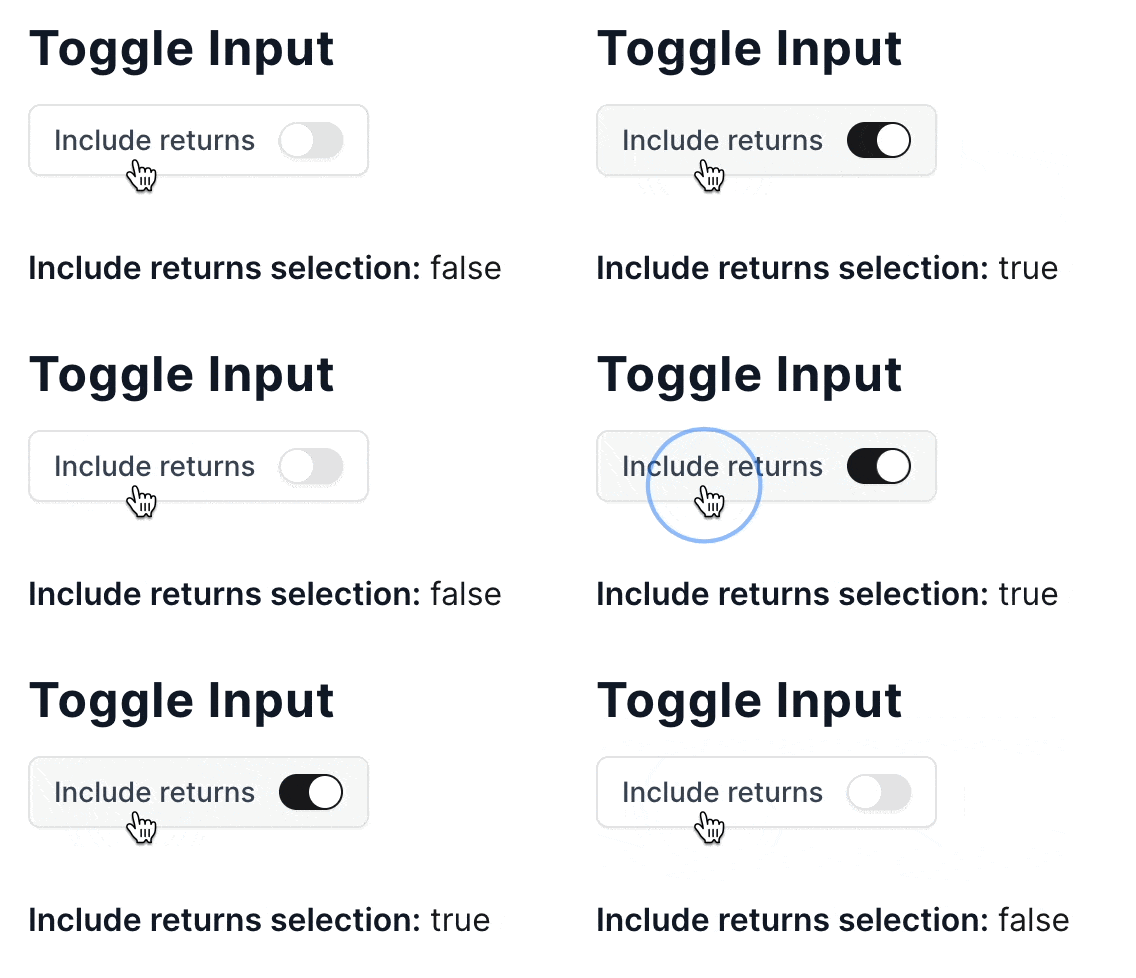
New Feature
✨ Button group and input tabs
New input components as visual alternatives to dropdowns:button_group and input_tabsNote that this update also deprecates the dropdown_option component in favour of the more general option component. The option component can be used inside dropdown, button_group, or input_tabs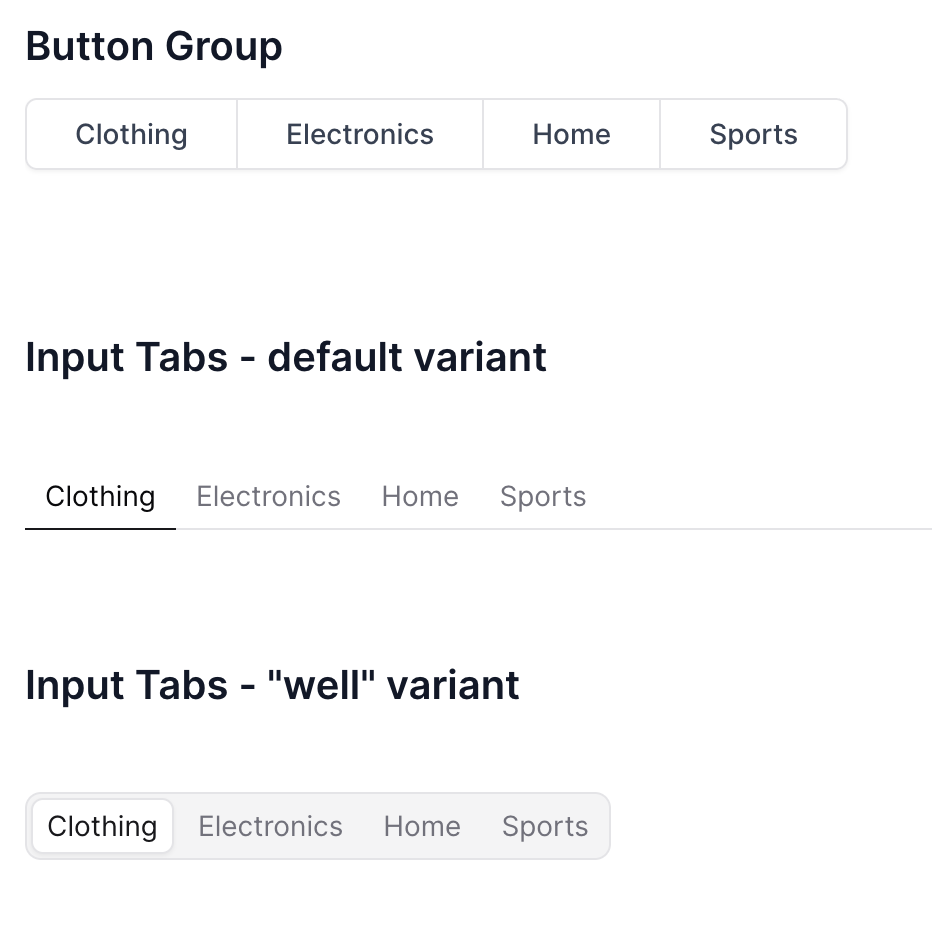
Improvement
🚀 Info Links
Add links to info text popovers usinginfo_link and info_link_title atttributes.Bug Fix
🐛 Fix for custom pivot formatting
Formatting for pivots now works as expected for custom date formats - e.g.,fmt="yyyy-mm"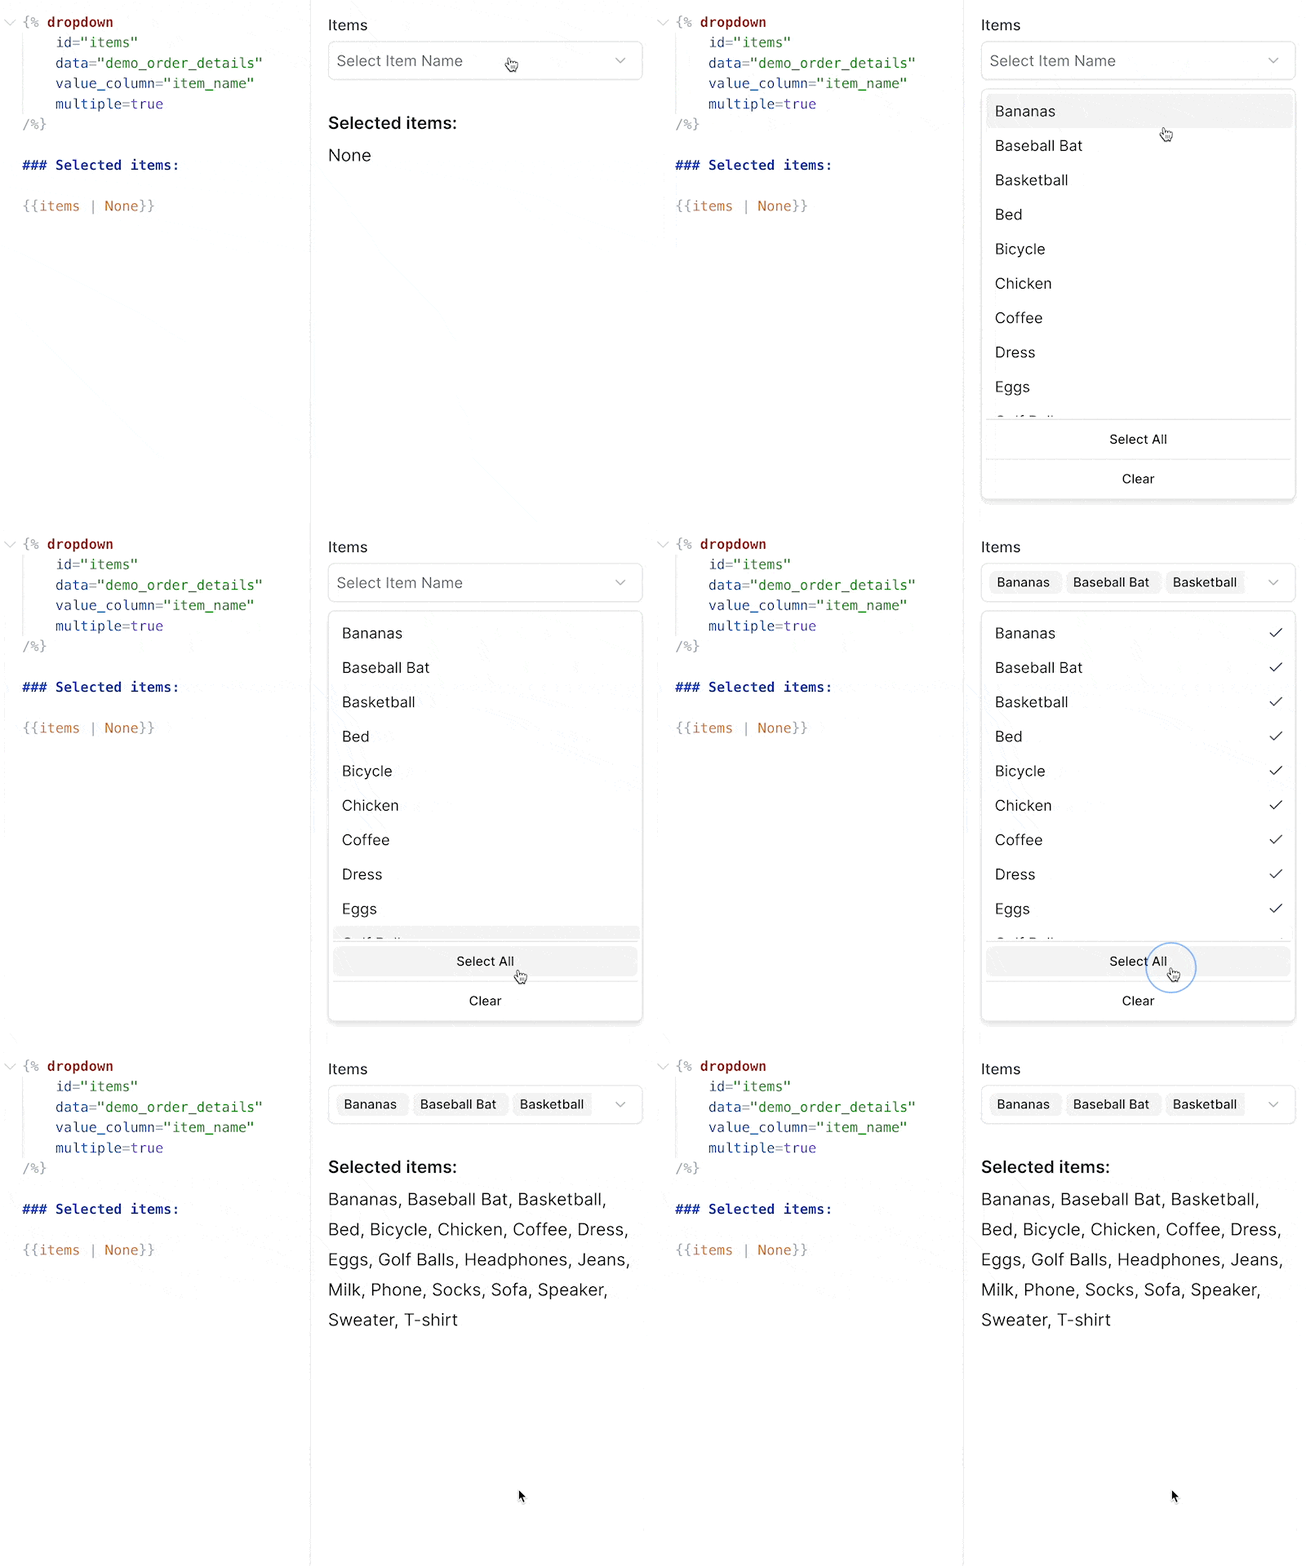
New Feature
New Feature
✨ Feature Requests
Submit and track feature requests directly in your settings menuFrom Settings > Feature Requests, you can create requests or bug reports, and set their priority. This integrates directly with the Evidence team’s roadmap, with status changes synced into your view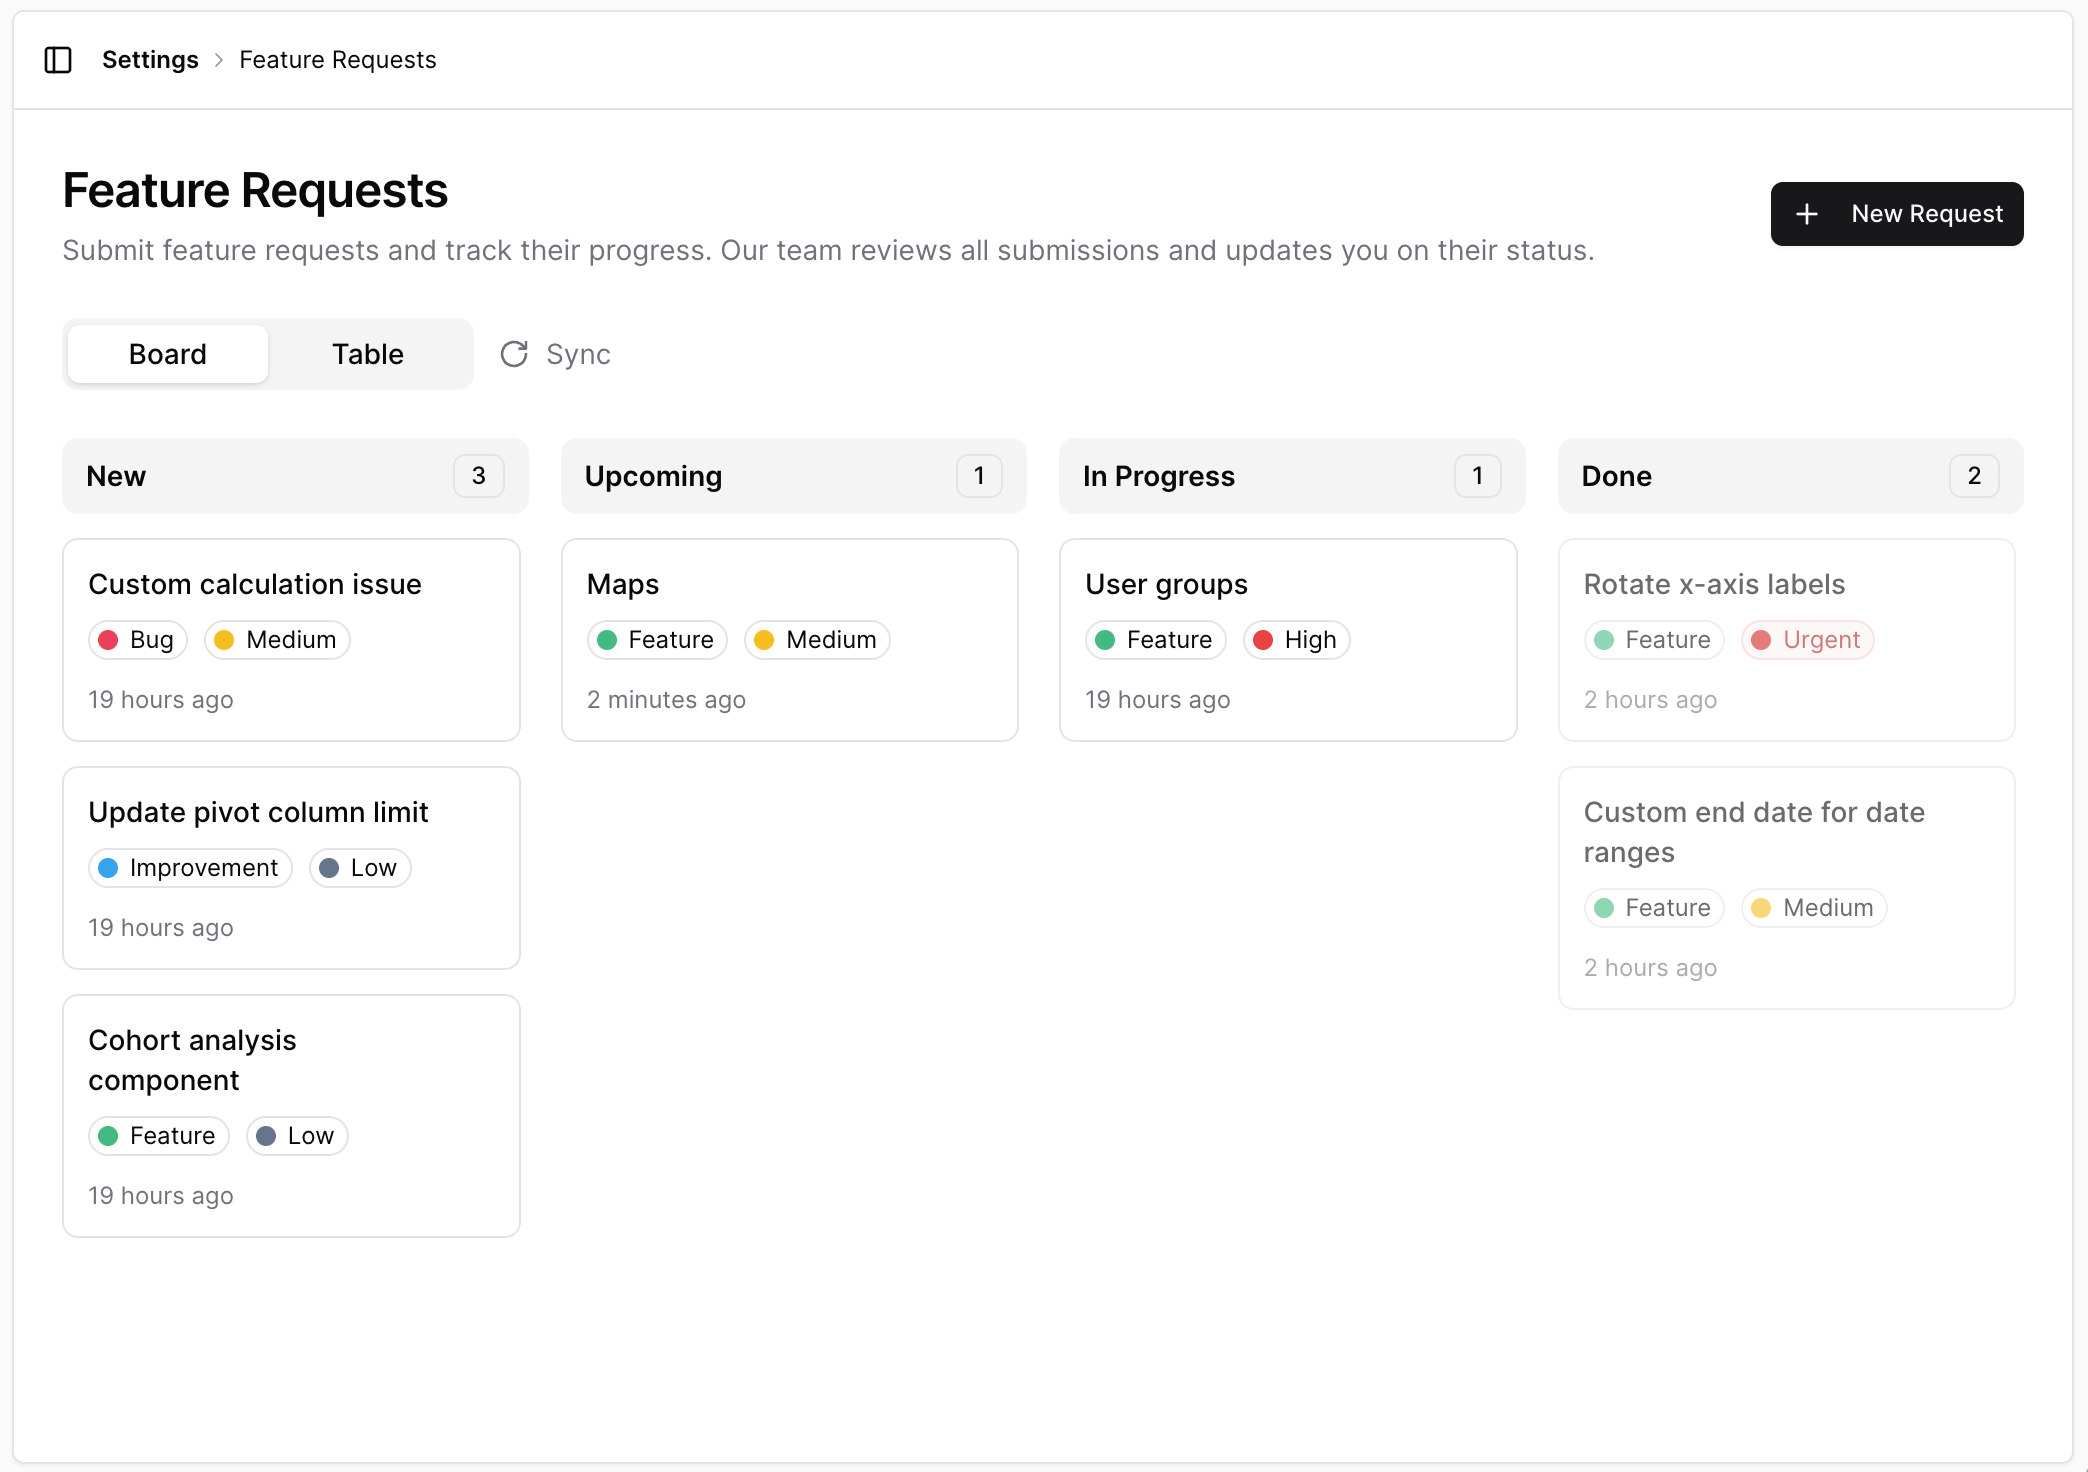
New Feature
✨ Stacked bar series in combo charts
Bar series in combo charts can now be stacked using the newstack_id attribute. Bars with the same stack_id will be stacked together, allowing for flexible combinations of stacked and grouped bars.View DocumentationNew Feature
✨ Max label length for x-axis labels
Truncate labels after a certain number of characters using themax_label_length attribute inside x_axis_options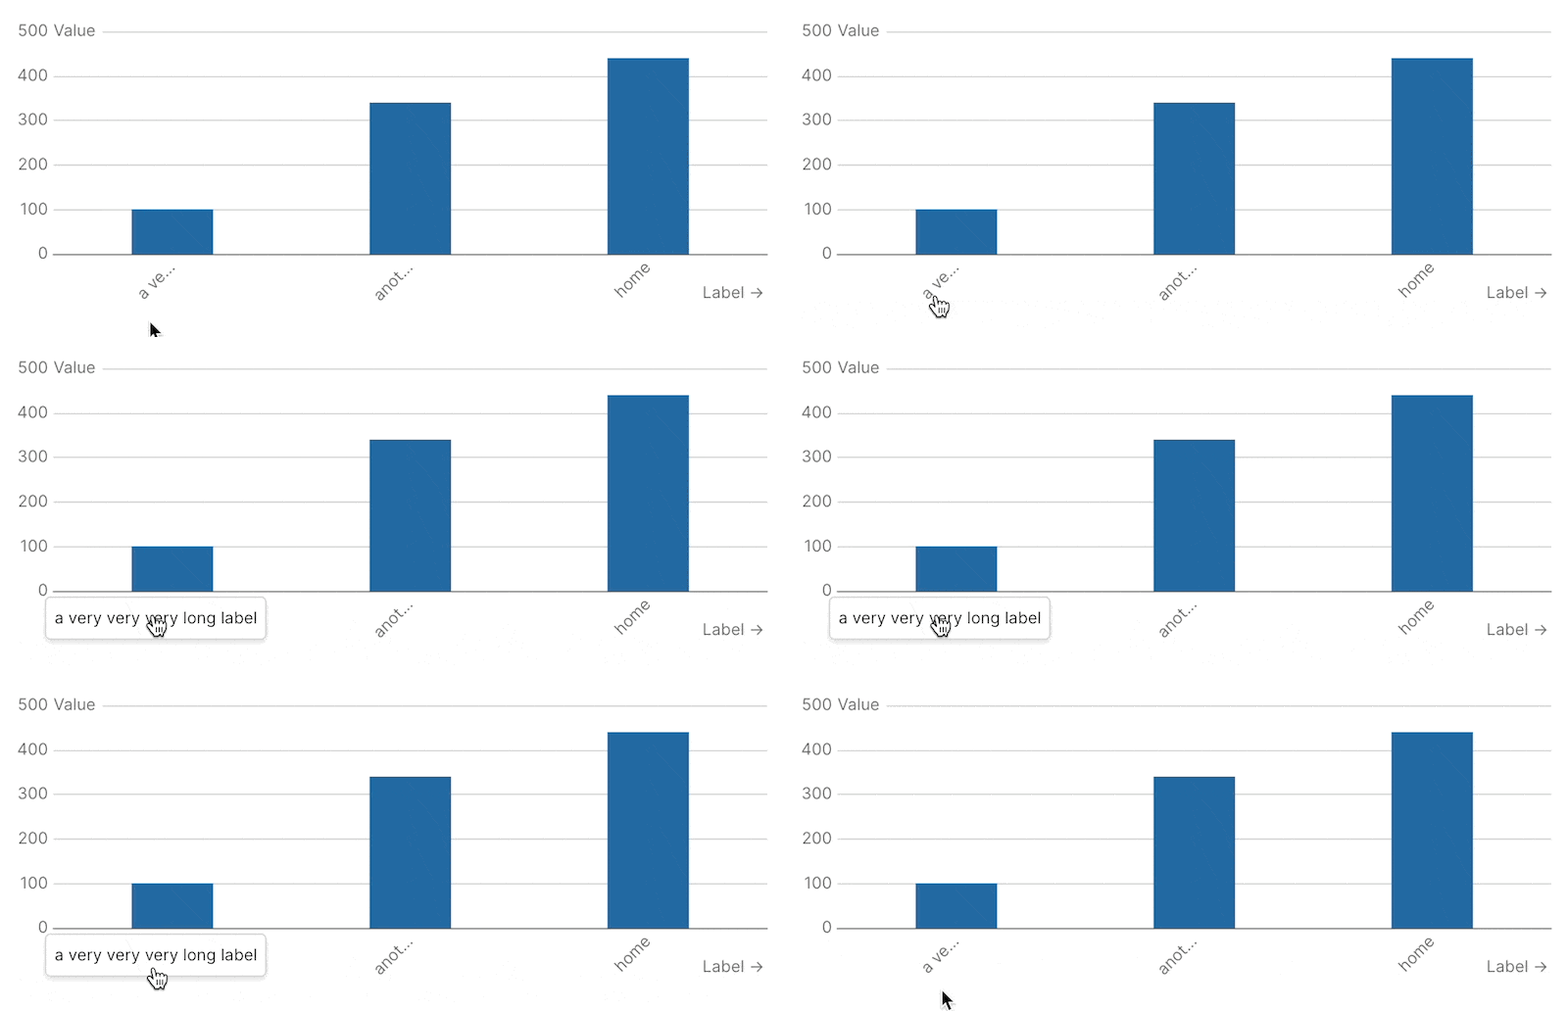
New Feature
✨ Rotate x-axis labels
Use the newlabel_rotate option in x_axis_options to rotate the labels on your x-axis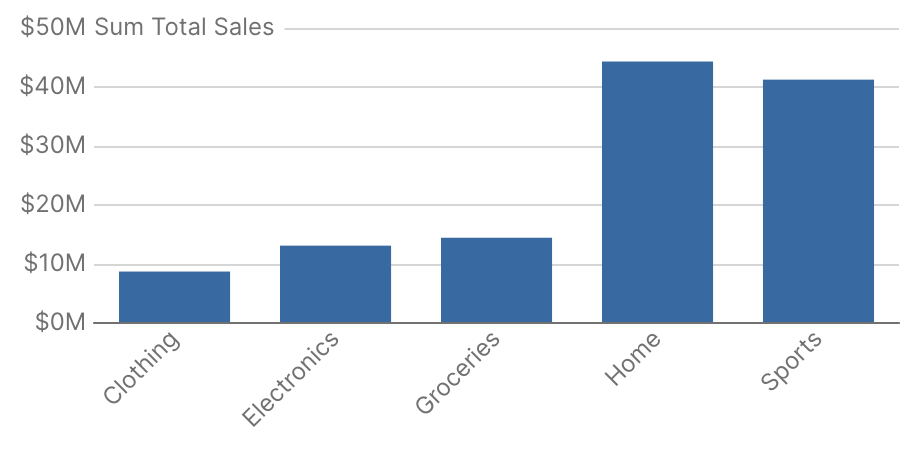
Improvement
🚀 Sidebar Icons and Sorting
Add custom icons and adjust the sort order of projects and pages in the sidebarNew Feature
✨ Jump to Code
In the editor preview, Cmd/Ctrl + click on a component to jump to the code for that componentYou can jump to code by Cmd/Ctrl + clicking a component in the preview pane, or you can jump to the component preview by Cmd/Ctrl + clicking the code in your editor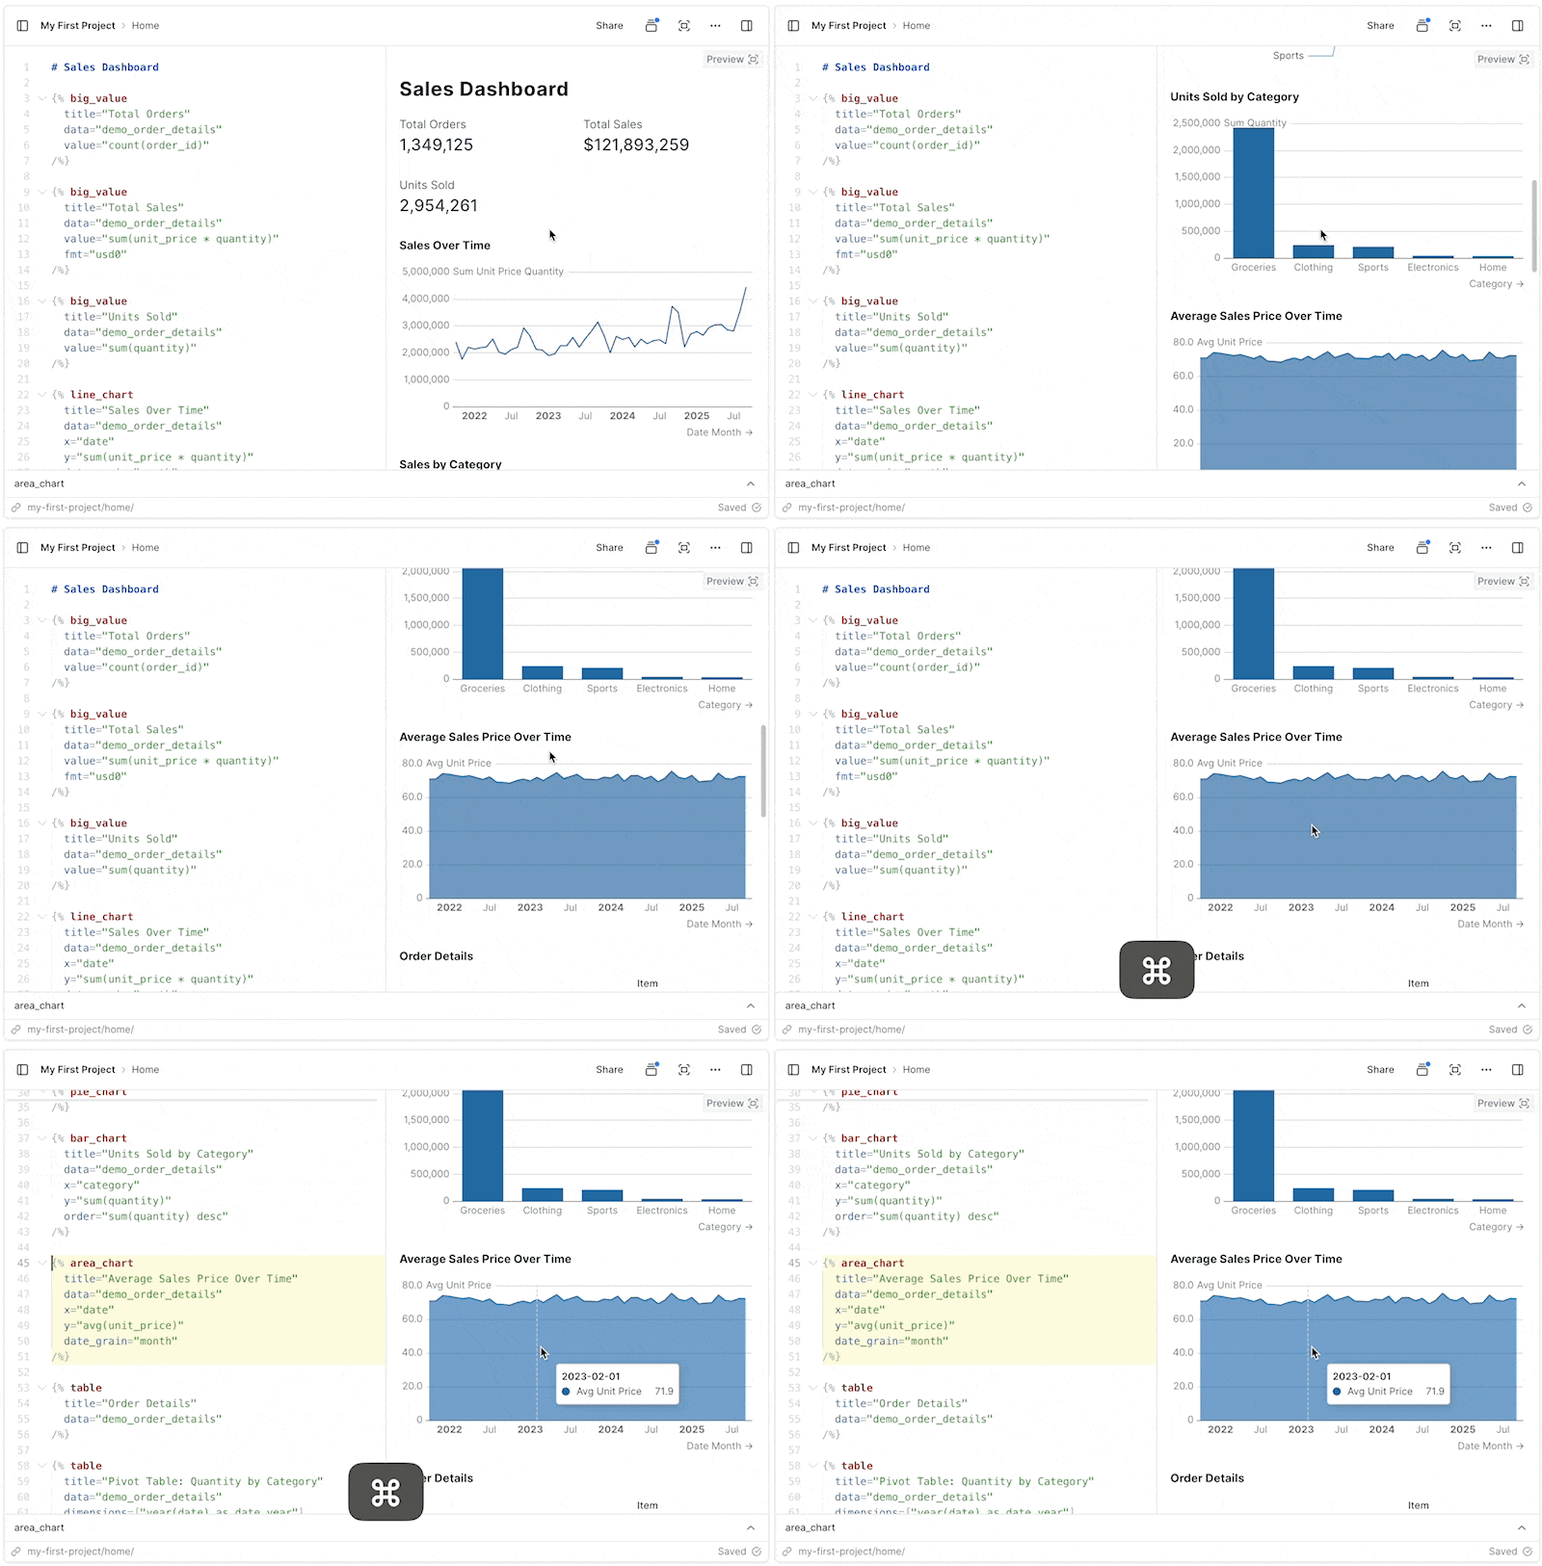
Improvement
🚀 Drag and drop image support
Drag, or paste images into the editor to add them to your page.New Feature
✨ Models (Beta)
Join sources together and materialize the results to improve performanceModels can be used to execute joins across sources, centralize type casting, and create clean tables to use when building reports. Models are run and materialized every 8 hoursView DocumentationNew Feature
✨ Set custom end date for date ranges
Use a dynamic end date for date ranges based on your data or a standard offsetBy default, date ranges end as of today’s date, but this setting allows you to choose a date based on a standard offset (e.g., 1 day ago) or by passing a sql query to calculate the date (e.g.,select max(date) from my_table)New Feature
✨ Bar chart opacity setting
Customize the opacity of bars in bar chart and combo chart componentsImprovement
🚀 Project Sections
Organize projects into sections for easier navigation during developmentSections will not impact how projects are arranged in the app published to Viewer usersBug Fix
🐛 Version control overflow
Fixes a bug where if you changed lots of files it overflowed the Version History panelNew Feature
✨ Option to choose first day of week
In project settings, you can now choose whether weeks start on Sunday or MondayImprovement
🚀 Better SQL Autocomplete Suggestions
Improved SQL suggestions for columns, and tables after joinsImprovement
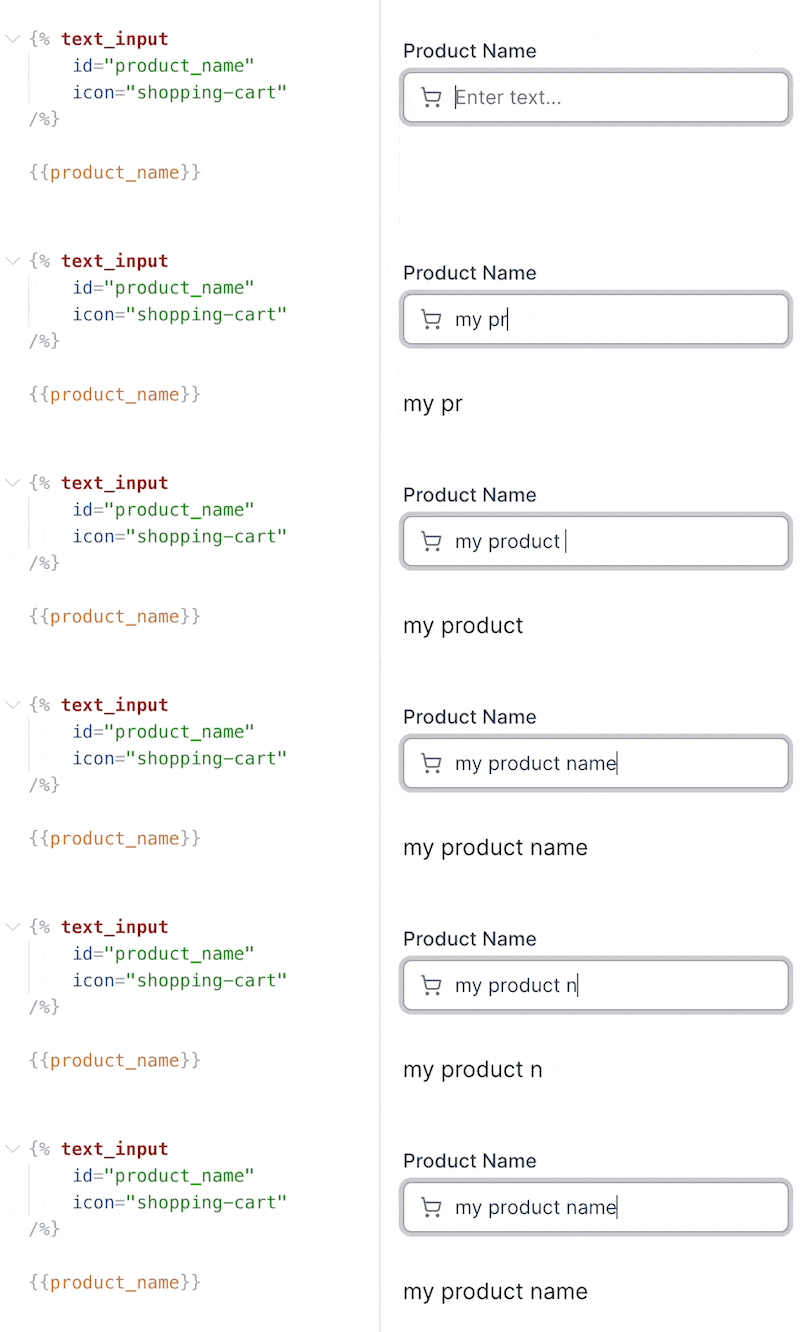
🚀 Variable name shortcuts + use in markdown
Variables no longer require specifying a property - simply use the name, like{{ my_var }}You can also use variables directly in markdown, including in headers and lists. You still have access to variable properties and can reference them like this: {{ my_var.selected }}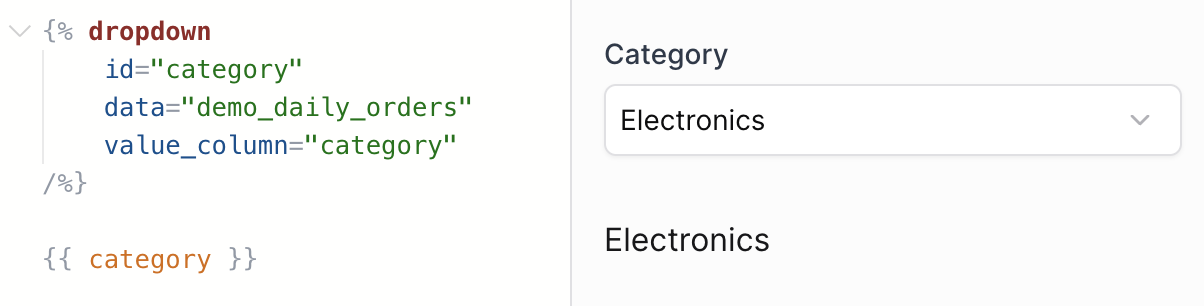
Improvement
🚀 Performance improvement for table comparisons
Tables containing comparisons should now load much fasterImprovement
🚀 More source sync info
View the number of rows in a source, and the amount of time it took for the source sync from the Sources page.New Feature
✨ Use variables inside components
You can now reference filter variables directly in component attributesSupports the following attributes: title, subtitle, info, where, date_grain, date_range.range, comparison.compare_vs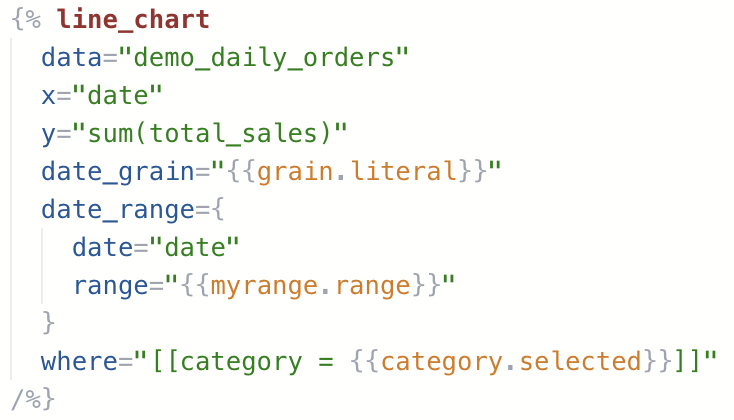
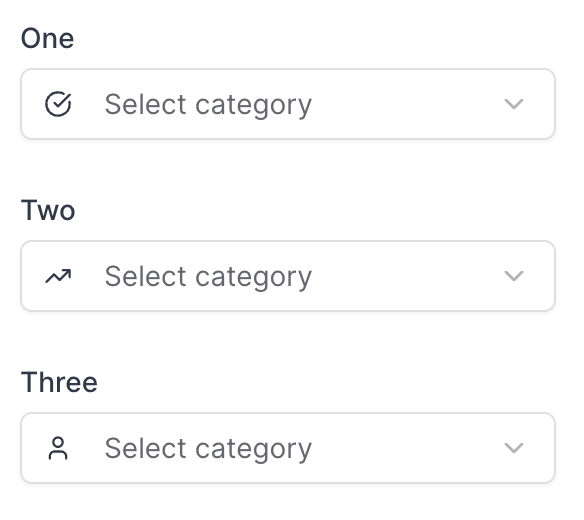
New Feature
✨ Selector components for date grain and comparisons
Special components for selecting date grain and comparisonsImprovement
🚀 Dynamic date ranges
Input arbitrary ranges into the date_range attribute in components, like “last 14 weeks” or “2023-01-14 to 2025-11-30”Bug Fix
🐛 Filter scroll fix
Fixed a bug where selecting a filter caused the page to jump back to the top.New Feature
✨ Select preset ranges in range calendar
Choose which preset ranges you want your users to see when clicking the range calendar componentBug Fix
🐛 SQL comments in inline queries
You can now add comments to inline queries without breaking themNew Feature
✨ Option to turn legend off in charts
You can now turn off chart legends with legend=falseImprovement
🚀 Conditional component render instantly
When previewing or viewing published pages, the initial state of any if/else_if/else conditions will be pre-calculated before the page loads.Improvement
🚀 Better label spacing on x-axis
Improvement to the alignment and spacing of labels on the x-axisBug Fix
🐛 Fix target comparison totals in table
Fixed an issue where target comparisons were hidden in total rowsBug FixBreaking Change
🐛 Improved date behaviour
Previously, database columns that returned Date type would return DateTime precision, which is confusing in the UI. Now dates will return no additional time componentValues that are Date type will no longer display time component in Tables, Values, and in various input components. Eg a Date previously formatted 2025-09-22T14:05:23Z would now be returned as 2025-09-22.Bug Fix
🐛 Fix Explore table resize and scroll
Fixes an issue where tables on the Explore page would resize and cut off contentImprovement
🚀 Comparison Tooltip Improvements
Fixed issue with percentage calculations for negative values. Added support for custom formats.New Feature
✨ Make Feature Requests in AI Chat
Now you can ask the Evidence chat to submit a feature request to the Evidence teamBug Fix
🐛 Fixed unexpected date offsets
In certain timezones, dates were being transposed by a small number of seconds in Chrome and Safari. This could cause date formats to render incorrectly, for example showing the day before the expected date.Improvement
🚀 RLS Enhancements
Added variable support for IN/NOT IN operators, ‘Apply All’ rule option, new panel interface, and per-user variable editing capabilities.Improvement
🚀 Improved Inline SQL Editor
See available variables, inline queries, and a preview of compiled SQL when editing queries in the inline SQL editor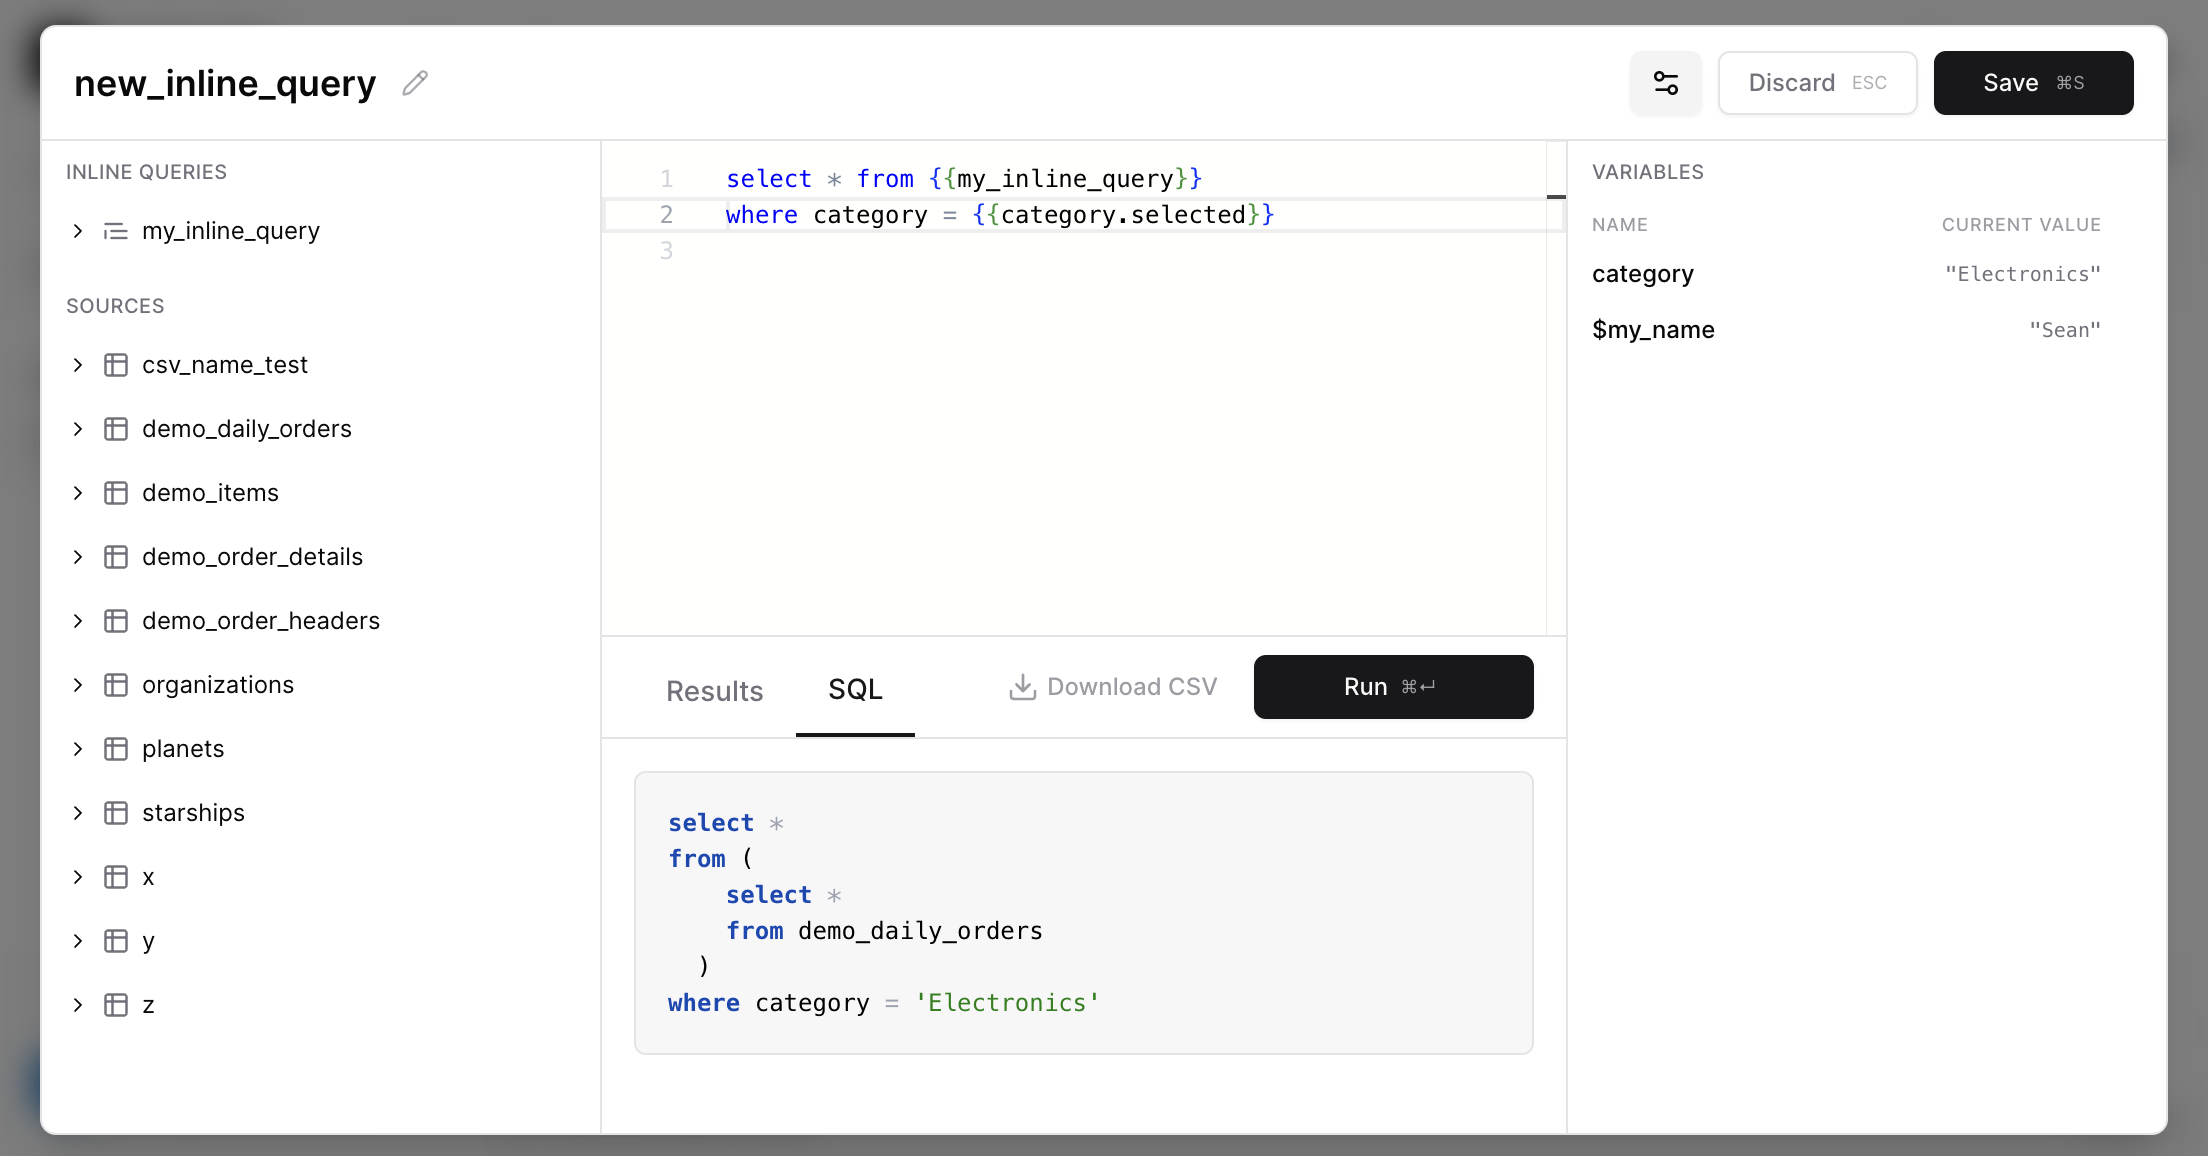
Improvement
🚀 Improved international character support in SQL queries
You can now include Japanese, Chinese, emoji, and other non-Latin characters directly in SQL passed to componentsNew Feature
✨ Page Loading (table)
Tables now load instantly on preview and published pagesThis is the first change in a journey to fully enable Server-Side Rendering in Evidence pages. The table is the first component to support this behavior, which enables the following features:- Tables load instantly on preview and published pages (no more loading spinner when the page loads)
- Chat can now debug SQL query errors in Table components
This change lays the groundwork for other components to opt into this new Server-Side Rendering system.
New Feature
✨ Add optional dark_url prop to image component
Image components can now display different images in light and dark modes using the newdark_url prop.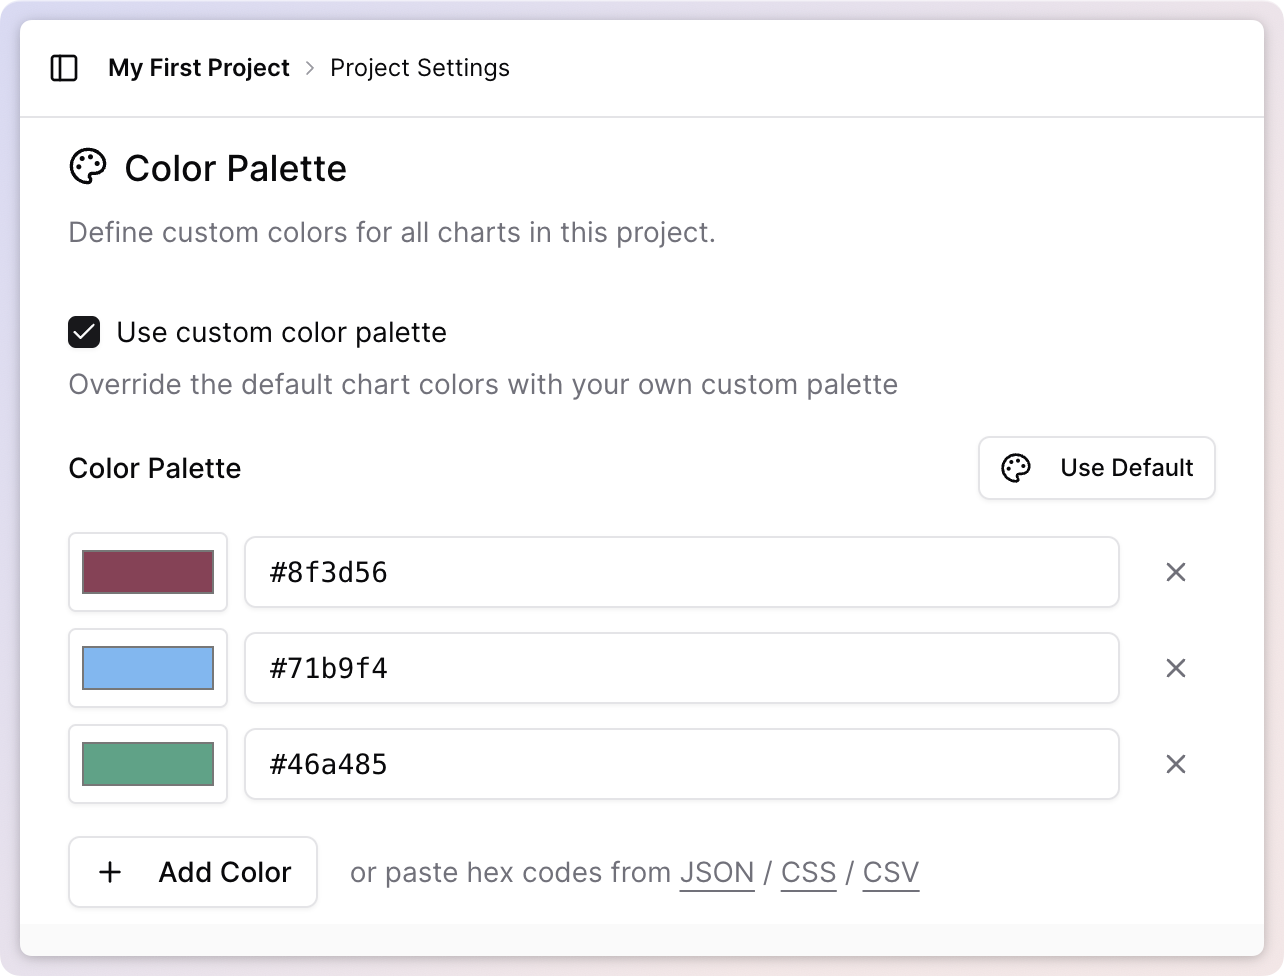
ImprovementBreaking Change
🚀 Improved Default Funnel Chart Styling
Funnel Charts are more intuitive to read, with a squared off style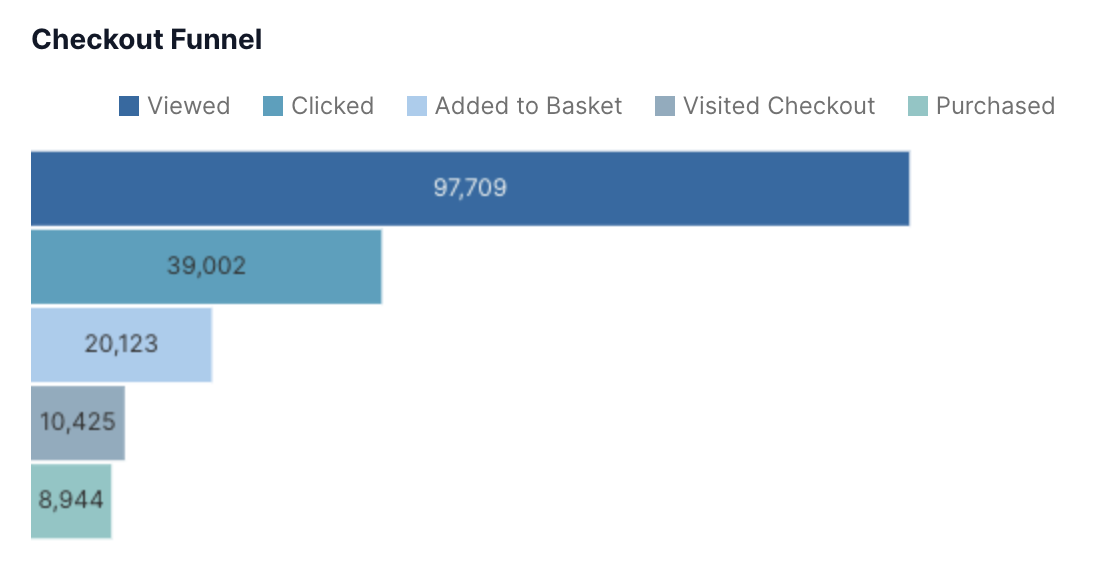
New Feature
New Feature
✨ Icon Component
Add icons inline into markdown, with configuration for color and size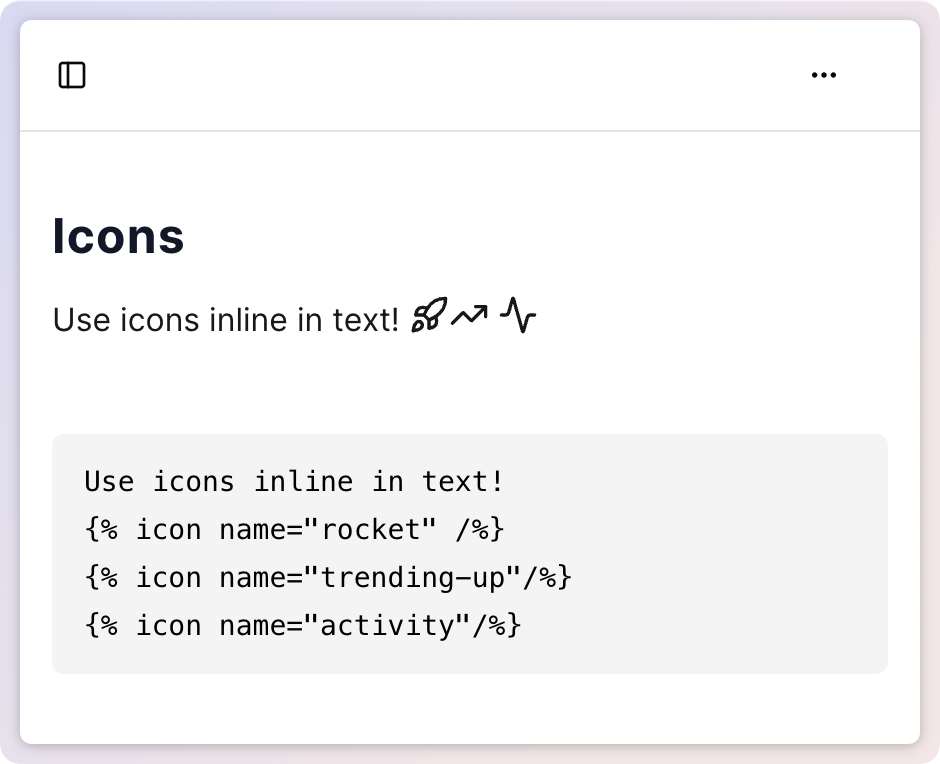
New Feature
✨ Row Level Security
Add rules to restrict which rows of are visible to users from sourcesAdd RLS rules to data source columns, and add user variables to determine which values in these columns allow access.View DocumentationImprovement
🚀 Custom Color Palettes
All charts now support custom color palettes via the “chart_options” attributePass an array of hex codes to the color_palette option e.g.color_palette=["#ff0000","#00ff00"]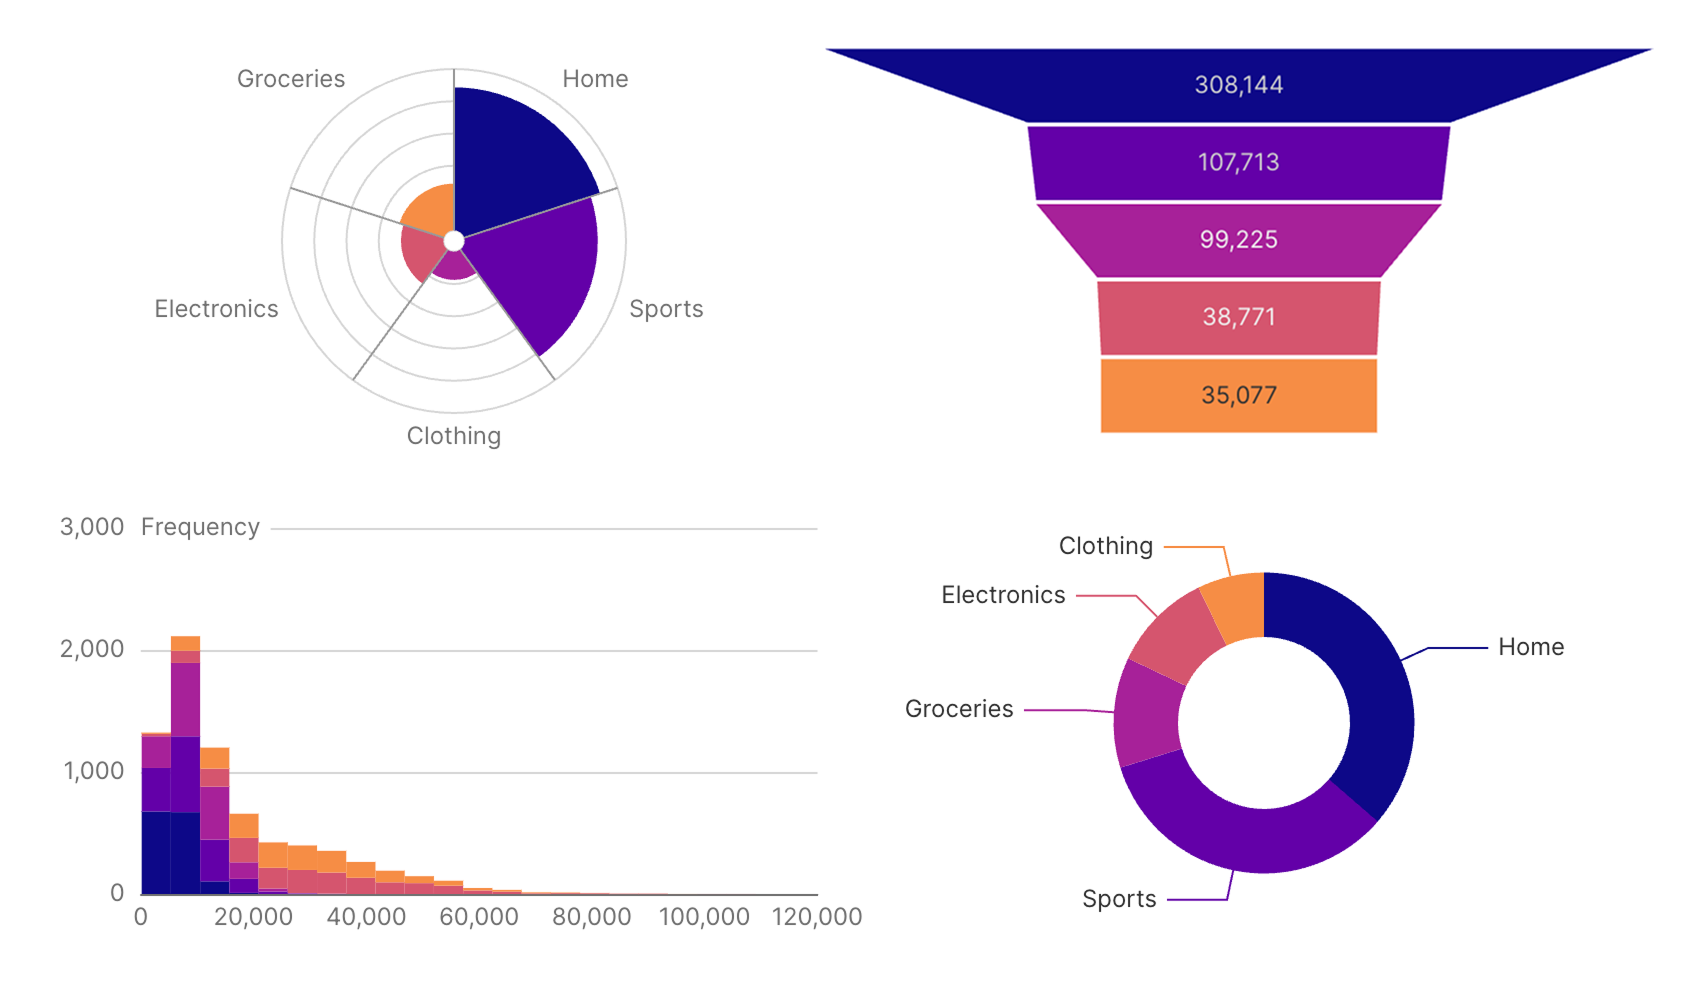
Bug Fix
🐛 Fix Editor Overwriting Bug
Fixed bug where switching pages and then hitting Ctrl+Z would overwrite your page with the content of the previous page.Bug Fix
🐛 Table Filter Option Overflow
Fixed a bug where long string values in the table filter overlapped each otherImprovement
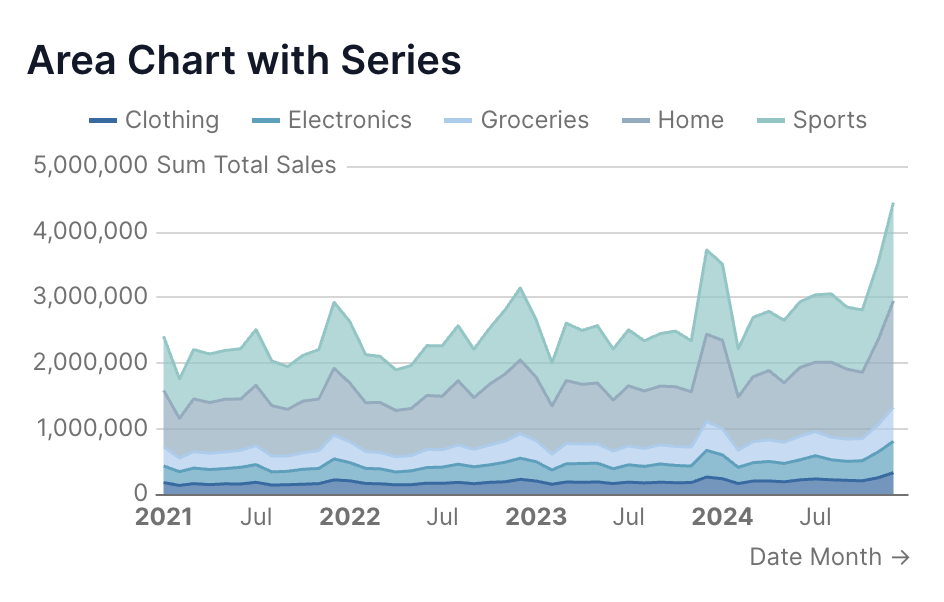
Bug Fix
🐛 Fix High Precision Decimals in Postgres
Resolves issue where tables containing decimal columns with more that 9 digits of precision were failing to publishImprovement
🚀 Editor Loading Speed
We’ve significantly improved the load speeds when switching between pages in the editor.New Feature
✨ Link Button
Use the link button to link to another page in Evidence or an external locationView DocumentationNew Feature
✨ Print Format Components
Add page breaks, print groups, and hide elements from PDF downloadsBug Fix
🐛 If / Else Behaviour Fix
Fixed some issues with the if /else components which sometimes caused them to not display information when they shouldBug Fix
🐛 Long Page Name Overflow
Long page and directory names now truncate in the sidebar to prevent the action button being hidden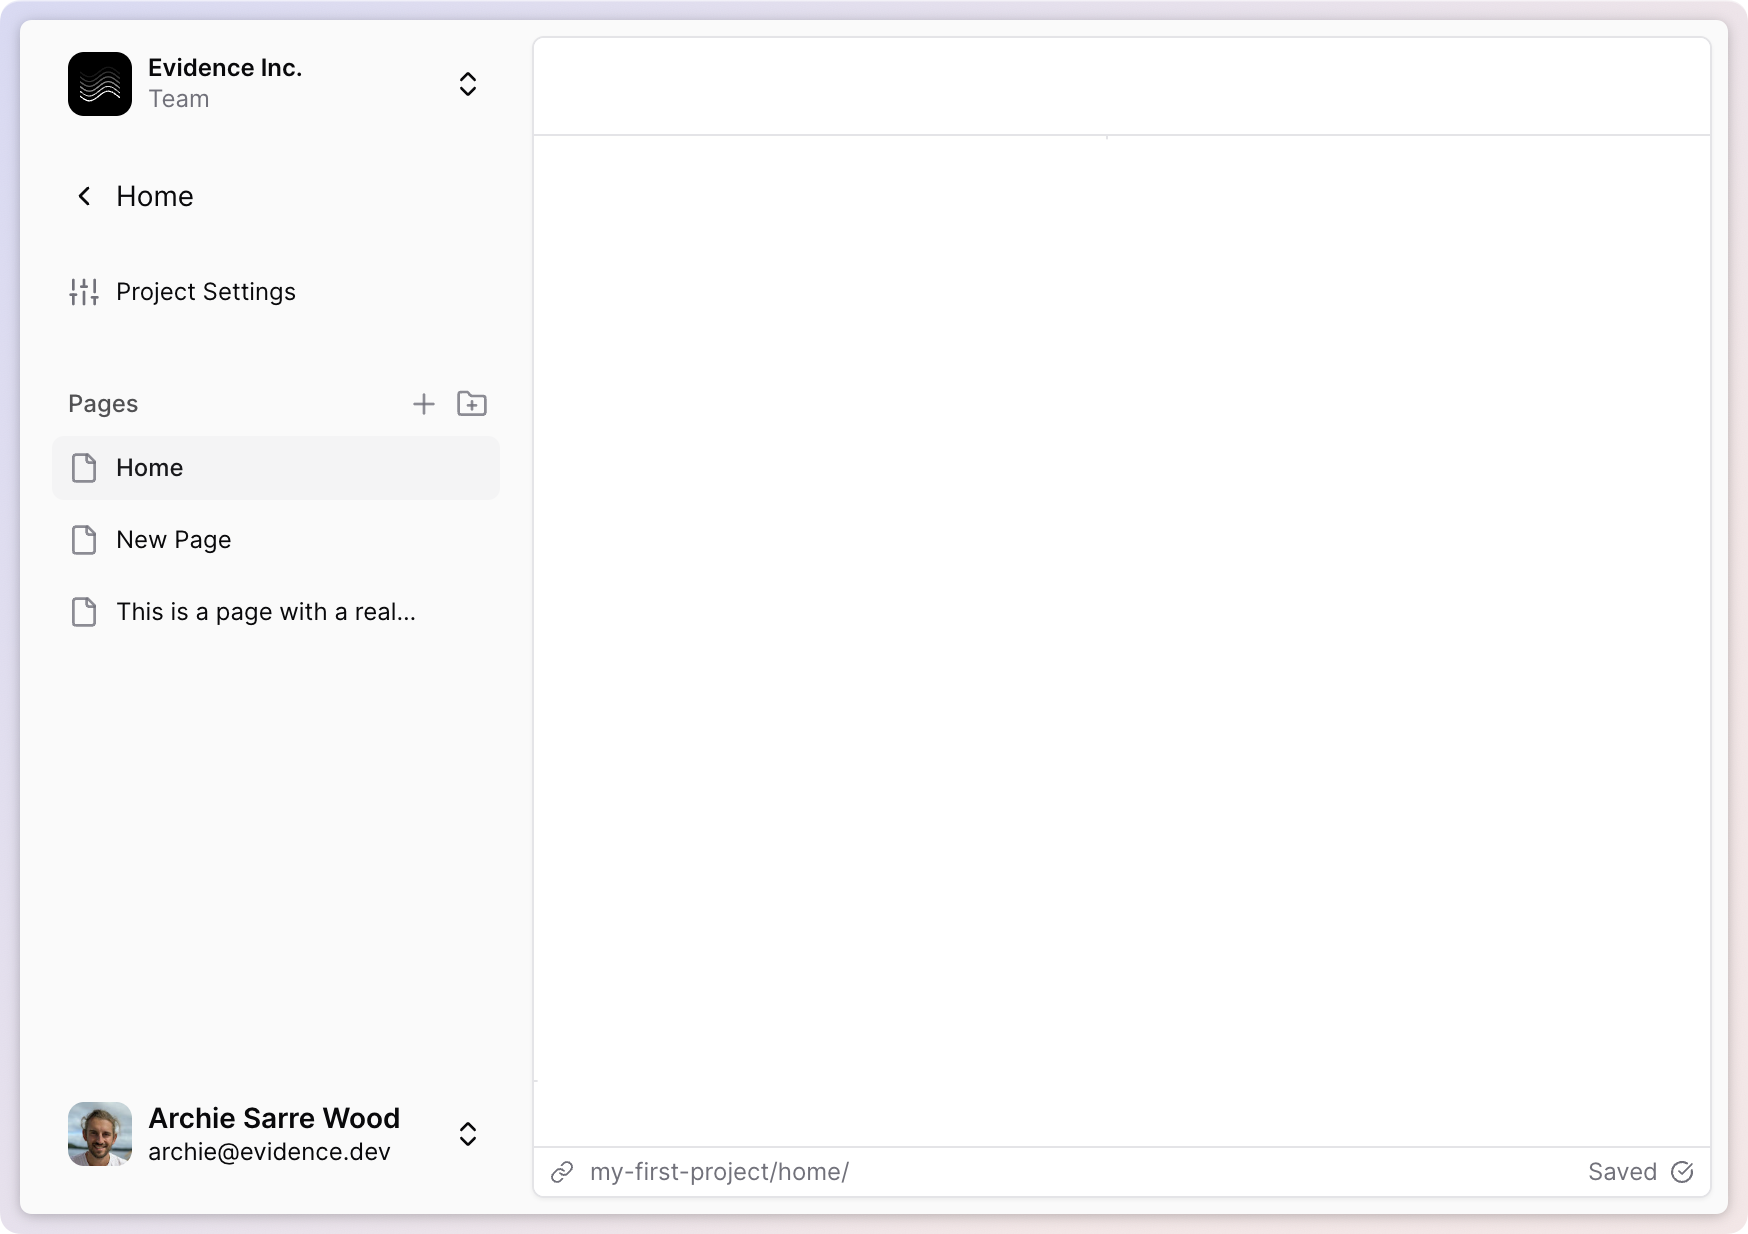
New Feature
✨ Variables
Define variables in frontmatter and use them in markdown, SQL and componentsView DocumentationNew Feature
✨ Conditional formatting in tables
Use color scale to conditionallyformat values in a tableImprovement
🚀 New date grain options
Inclues special grains like ‘day of week’ and ‘month of year’, with built-in labelsNew Feature
✨ Period over period comparisons
Automatically compare values vs. prior year, prior period, or target. Available in table and big value.Bug Fix
🐛 Delete Connections Fix
Fixed a bug which only allowed you to delete the most recently added connectionNew Feature
New Feature
New Feature
New Feature
✨ Page linking
Link to other Evidence pages using markdown linksBug Fix
🐛 Respect columns option in table filter
Fix bug which ignored columns selection in table filterBug Fix
🐛 Table filter responsiveness
Fix bug which prevented table filter inputs from taking effect immediately after adding the table filter to the page.New Feature
✨ Filter interpolation
Reference filter values inside of inlined queries, and view the state of your filters in the new filters pane of the devtools sidebar.View DocumentationImprovement
🚀 Agent Keyboard Shortcut
Ctrl+Alt+I (Mac: Cmd+Shift+I) to open a chat with the Evidence agent from anywhere in the EditorNew Feature
New Feature
✨ Reference Components
Usereference_line, reference_area, and reference_point to add reference annotations to your chartsView DocumentationImprovement
🚀 Postgres Schema Support
Use tables in any Postgres schema (not just the default “public” schema)Improvement
🚀 Public Documentation
We’ve published full documentation at https://docs.evidence.studioNew Feature
✨ Card Option for Row and Stack Components
Addedcard option to row and stack components to display their contents as a single card.New Feature
✨ Downloadable Data
Right click any chart to download its data, or use the kebab menu in the top left of the published page to download a whole page’s data.New Feature
✨ Chart, Axis, and Series Options
Newchart_options, x_axis_options, y_axis_options, y2_axis_options, and series options for customizing your charts.Bug Fix
🐛 Inline Query Date Validation
Fixes issue creating visualizations using inline queries with datesNew Feature
✨ Markdown Comments
Adds support for mardown comments with<!— —>. Mac: Cmd + / Windows: Ctrl + /New Feature
✨ Combo Chart
Added acombo_chart component that allows you to combine area, bar, bubble, line, and scatter series on one chart.New Feature
✨ Accept and Reject Changes Panel in Diff View
Added accept and reject buttons to the top of the diff view.Bug Fix
🐛 Fix to give AI agent knowledge of inline queries
Fixed the issue where the AI agent did not know about inline queries on your page.Bug Fix
🐛 Fix to Maintain Chart Height
Fixed the issue where the chart height was shrinking when title and legend were added.New Feature
✨ Custom X and Y Chart Titles
Added the ability to customizex_title and y_title for charts.New Feature
✨ Changelog
We’re shipping features and fixes very quickly. Keep an eye out here for updates.Bug Fix
🐛 Fix Slash Commands When Inside Parent Component
Fixed the issue where slash commands were not working when inside a parent component.Improvement
🚀 Helpful Warning for Aggregating Columns
Added a warning to consider aggregating a column for a chart.New Feature
✨ Open Chat Automatically for Fix in Chat
When the fix in chat button is pressed, the chat window will open automatically.Improvement
🚀 Collapse the Sidebar
Added the ability to collapse and expand the sidebar on all screen sizes.Improvement
🚀 Fix in Chat Now Available on All Error Messages
Error messages throughout the platform now include the fix in chat feature.Improvement
🚀 More Readable SQL Errors
SQL error messages have been redesigned to be clearer and more actionable.Bug Fix
🐛 Row and Stack Components
Fixed issues with Row and Stack components rendering and layout behavior.New Feature
✨ European Number Formatting
Support for European number format using comma as the decimal separator (e.g., 1.234,56 instead of 1,234.56).New Feature