

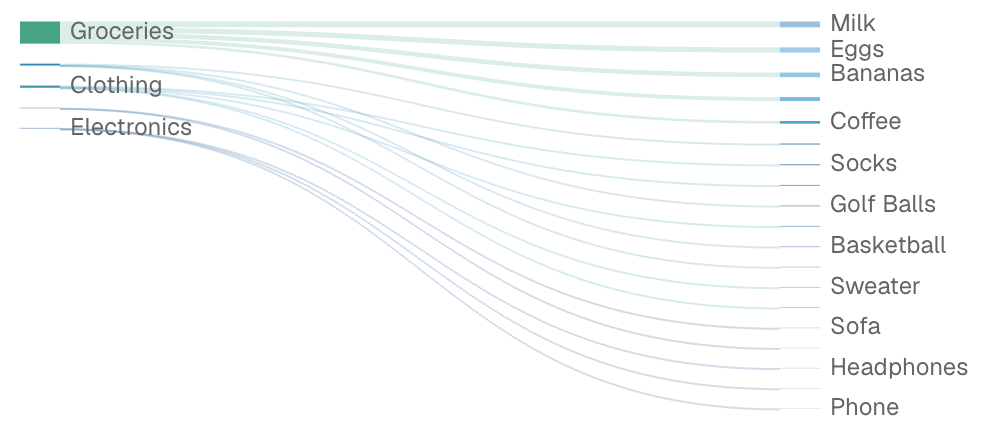
Examples
Basic Usage
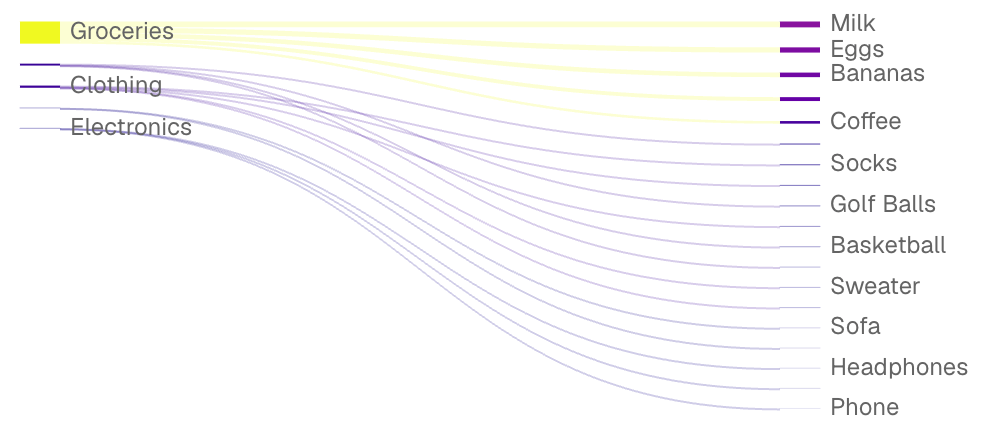
Sankey Chart with Custom Colors
Attributes
string
Name of the table to query. Omit when using
metric.string
Semantic metric name to display, from metrics/*.yaml. Use instead of the raw data/value/x/y attributes.
array
IDs of filters to apply to the query
options group
Filter data to a time period. Attributes:
date_range is an OBJECT with range (the period) and optionally date (which column to filter on when the table has more than one). Shape: date_range={ range="last 12 months" date="order_date" }. range accepts predefined values (last 7 days, month to date), dynamic patterns (Last 90 days), custom windows (2020-01-01 to 2023-03-01), or partial ranges (from 2020-01-01, until 2023-03-01). Pass a plain string for range — the whole object is NOT a string.Example:- range:
string- Time period to filter. Use presets like ‘last 7 days’, dynamic patterns like ‘Last 90 days’, custom ranges like ‘2020-01-01 to 2023-03-01’, or partial ranges like ‘from 2020-01-01’.- Allowed values:
todayyesterdaylast 7 dayslast 30 dayslast 3 monthslast 6 monthslast 12 monthsprevious weekprevious monthprevious quarterprevious yearthis weekthis monththis quarterthis yearnext weeknext monthnext quarternext yearweek to datemonth to datequarter to dateyear to dateall time
- Allowed values:
- date:
string- Date column to filter on. Required when the data has multiple date columns.
string
required
Column name for source nodes
string
required
Column name for target nodes
string
Column name for flow values. Omit when using
metric.string
Column name for percentage values (optional)
string
Title to display above the chart
string
Subtitle to display below the title
string
Information tooltip text (can only be used with title)
string
URL to link the info text to (can only be used with info)
string
Create a custom link title for the info link, placed after the info text (can only be used with info_link)
string
Format for values (defaults to
num, or the metric format in metric mode). See Value Formatting for available formats.string
default:"name"
Node label displayAllowed values:
namevaluefull
string
Link label displayAllowed values:
valuepercentfullnone
string
default:"justify"
Node alignmentAllowed values:
justifyleftrighttopbottom
number
default:"10"
Gap between nodes in pixels
number
default:"20"
Width of nodes in pixels
string
default:"horizontal"
OrientationAllowed values:
horizontalvertical
boolean
default:"false"
Sort nodes by value
string
default:"source"
Link color modeAllowed values:
sourcetargetgradient
string
Node outline color
number
default:"0"
Node outline width in pixels
options group
Chart configuration optionsExample:Attributes:
- color_palette:
array of strings
number
Time in seconds between automatic data refreshes (minimum 30). Overrides the page-level auto-refresh setting for this component.
string
Custom SQL WHERE condition to apply to the query. For date filters, use date_range instead.
string
Custom SQL HAVING condition to apply to the query after GROUP BY
number
Maximum number of rows to return from the query. Note: When used with tables, limit will disable subtotals to prevent incomplete subtotal rows.
string
Column name(s) with optional direction (e.g. “column_name”, “column_name desc”)
string
Custom SQL QUALIFY condition to filter windowed results
number
Set the width of this component (in percent) relative to the page width
number
Set a fixed height for the chart in pixels
string
Link this chart to others sharing the same id, syncing their tooltips, axis-pointer, and zoom
array
Extra columns to include in the tooltip on hover. Each entry is
{ value, label?, fmt?, color_by_sign?, down_is_good? }. See the tooltip fields guide for examples.map
Raw ECharts options deep-merged over the chart’s final configuration. Use for anything the structured props do not expose —
graphic, visualMap, tooltip styling, and so on. Partial overrides win key-by-key without clobbering Studio’s computed siblings. For overrides scoped to the data series, use echarts_series_options.Example:map
Raw ECharts series options deep-merged into the chart series. Use for series-level styling the structured props do not expose.Example: