

Components
What are Components?
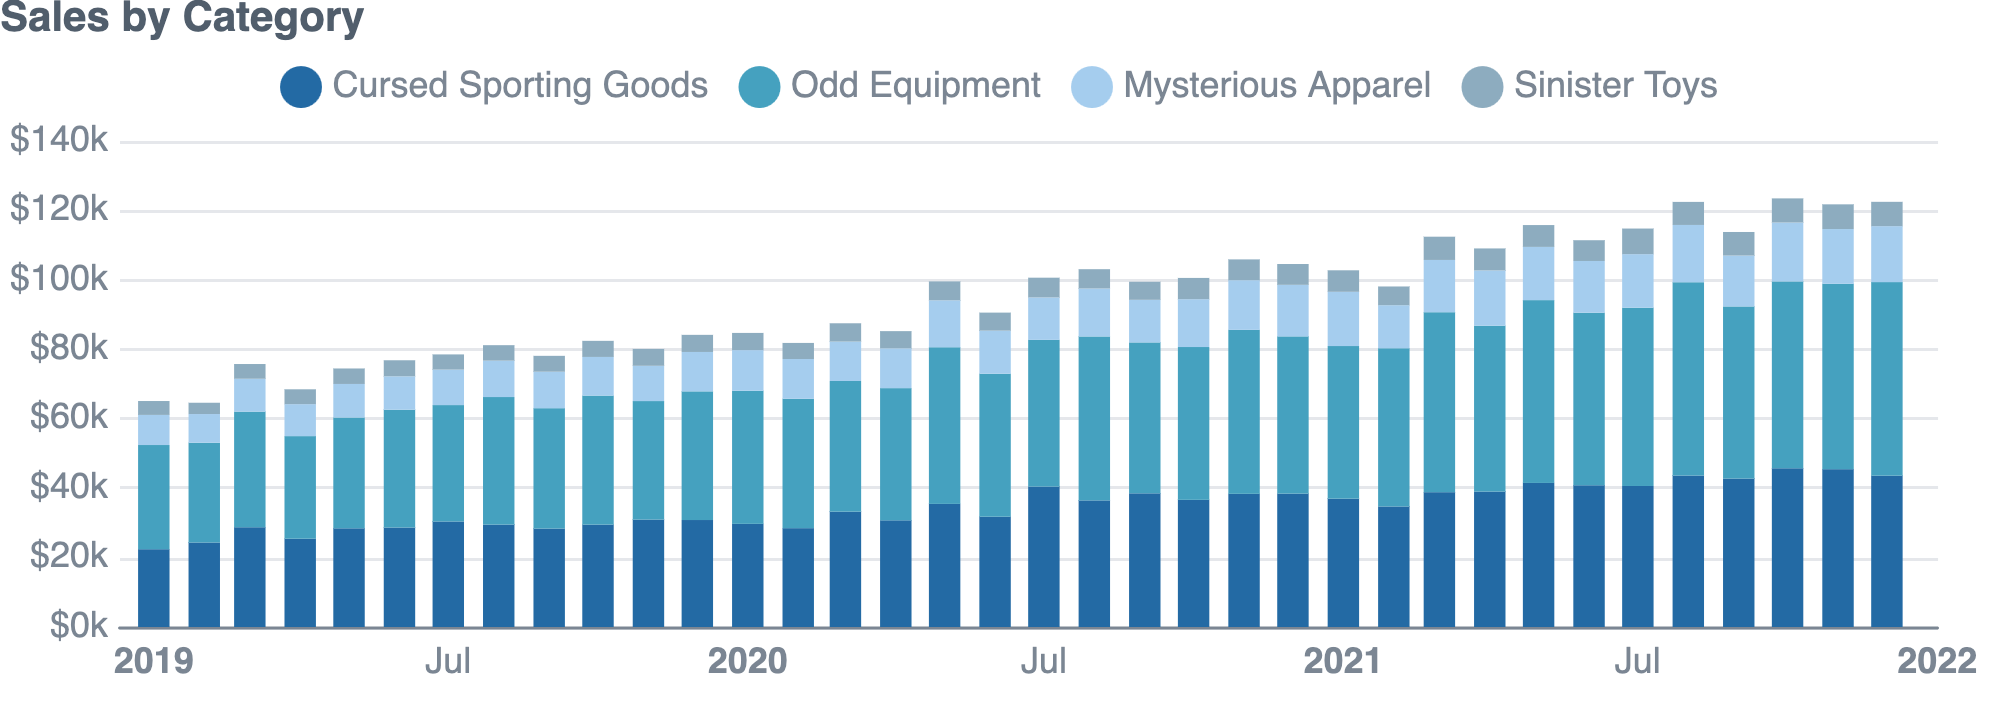
Evidence has a built in component library to create charts and other visual elements.
Components use angle brackets (<.../>) to wrap the component name, like HTML syntax. Data from a query, and configuration options are passed in as properties, or "props":
<BarChart
	data="{orders_by_month}"
	x="order_month"
	y="sales_usd0k"
	series="category"
	title="Sales by Category"
/>
Showing Values in Text
The simplest component is the <Value/> component. It displays a single value from a query. It can be used to put automatically updated values in text.
```sql orders
SELECT
    '2021-01-01' AS date,
    100 AS num_orders
```

The number of orders yesterday was <Value data = {orders} column = num_orders />.
Above, we've passed in the query data orders in curly braces { }, and specified the column we want to display num_orders in the column prop.
For more information on the Value component, see the Value docs.
Charts
Our chart library has a flexible, declarative API that lets you add default chart types, or create your own.
While our library offers a lot of customizable features, we include sensible defaults that look good out of the box.
Props and defaults
At a minimum, all charts require a data prop, but for other props Evidence has default assumptions to reduce the amount of configuration required.
Data
- All charts require a data prop, which should contain a query result wrapped in
{...}(e.g.,data={query_name})
x and y
- All x-y coordinate (AKA Cartesian) charts require
xandycolumns to create the axes and scales for the chart ycan accept multiple columns, but can only plot on a single axis at this time.- We have built-in assumptions to make writing the chart code easier:
- If you don't supply
x, the first column in the dataset is assumed to bex - If you don't supply
y, any numerical columns that you have not already assigned to the chart are assumed to bey
- If you don't supply
Multiple Series
- To plot multiple series (or groups) on your chart, you can do one of the following (or both):
- Include a
seriescolumn, which contains category or group names (e.g,series=country) - Include multiple
ycolumns - each column will be treated as an individual series (e.g.,y={["y1", "y2"]})
- Include a
Annotations
Charts can include annotations using the ReferenceLine and ReferenceArea components. These components are used within a chart component like so:
<LineChart data={sales_data} x=date y=sales>
  <ReferenceLine data={target_data} y=target label=name/>
</LineChart>
Custom Components
You can also build your own reusable data viz or UI components in Evidence. See the Custom Component Guide for more details.