

Build Your First App
This is a guided tutorial to help you build your first Evidence app. If you'd prefer to learn how Evidence works, start with the Syntax.
By the end of this 10 minute guide, you will be able to:
- Create and edit a page in Evidence
- Write a query on demo data
- Create a table
- Create a chart
- Connect a new CSV data source
Prerequisites
Please ensure that you have already installed Evidence: Install Evidence.
If you are new to web development, start with the Basics.
If you are familiar with running a server at localhost, and writing pages in Markdown, skip to Working with data.
Basics
1. Start Evidence
Evidence can be started from VSCode, or from the Command Line. Both will work for this tutorial. If you're unsure, start with VSCode:
If you chose a different setup during Install Evidence, use the command that matches your setup.
Your browser should open automatically. If it doesn't, open your browser and navigate to localhost:3000 in the address bar. You should see your Evidence app:
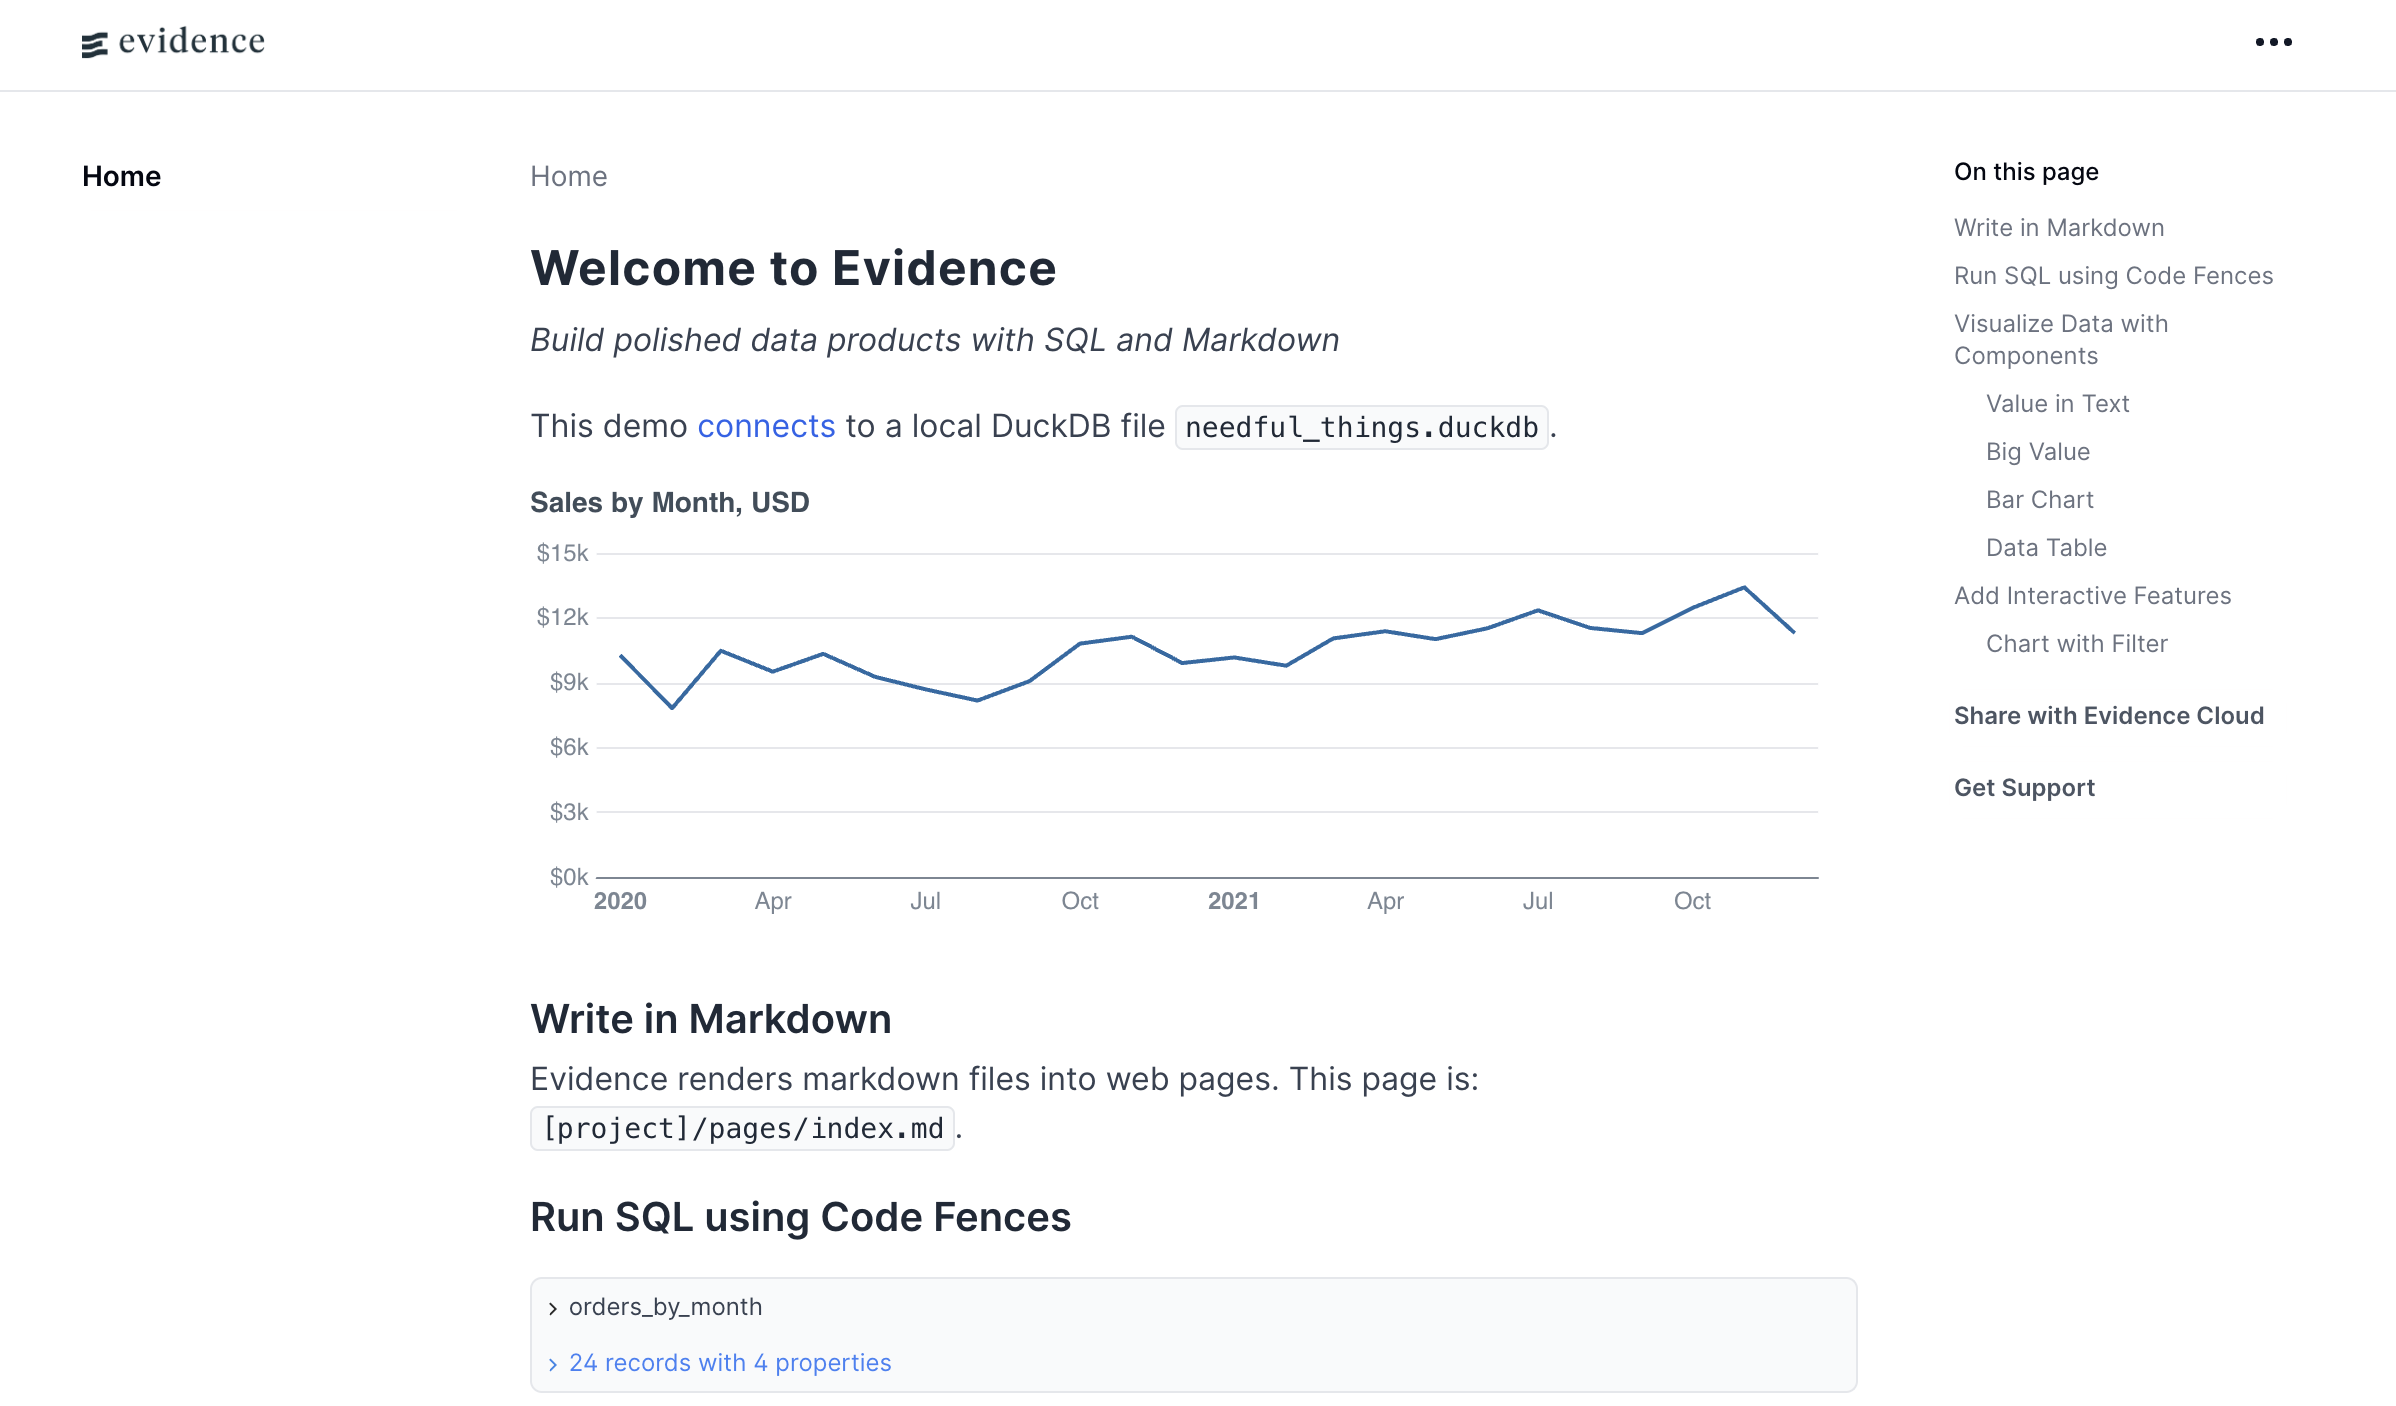
You have now started Evidence in a local development server on your own machine.
2. Add a new page
Go back to VSCode (or your file editor of choice) and open the src/pages directory. Right-click on the pages directory and select New File. Name the file new-page.md, or a name of your choice.
Add the following to the file and save it (Ctrl+S or Cmd+S):
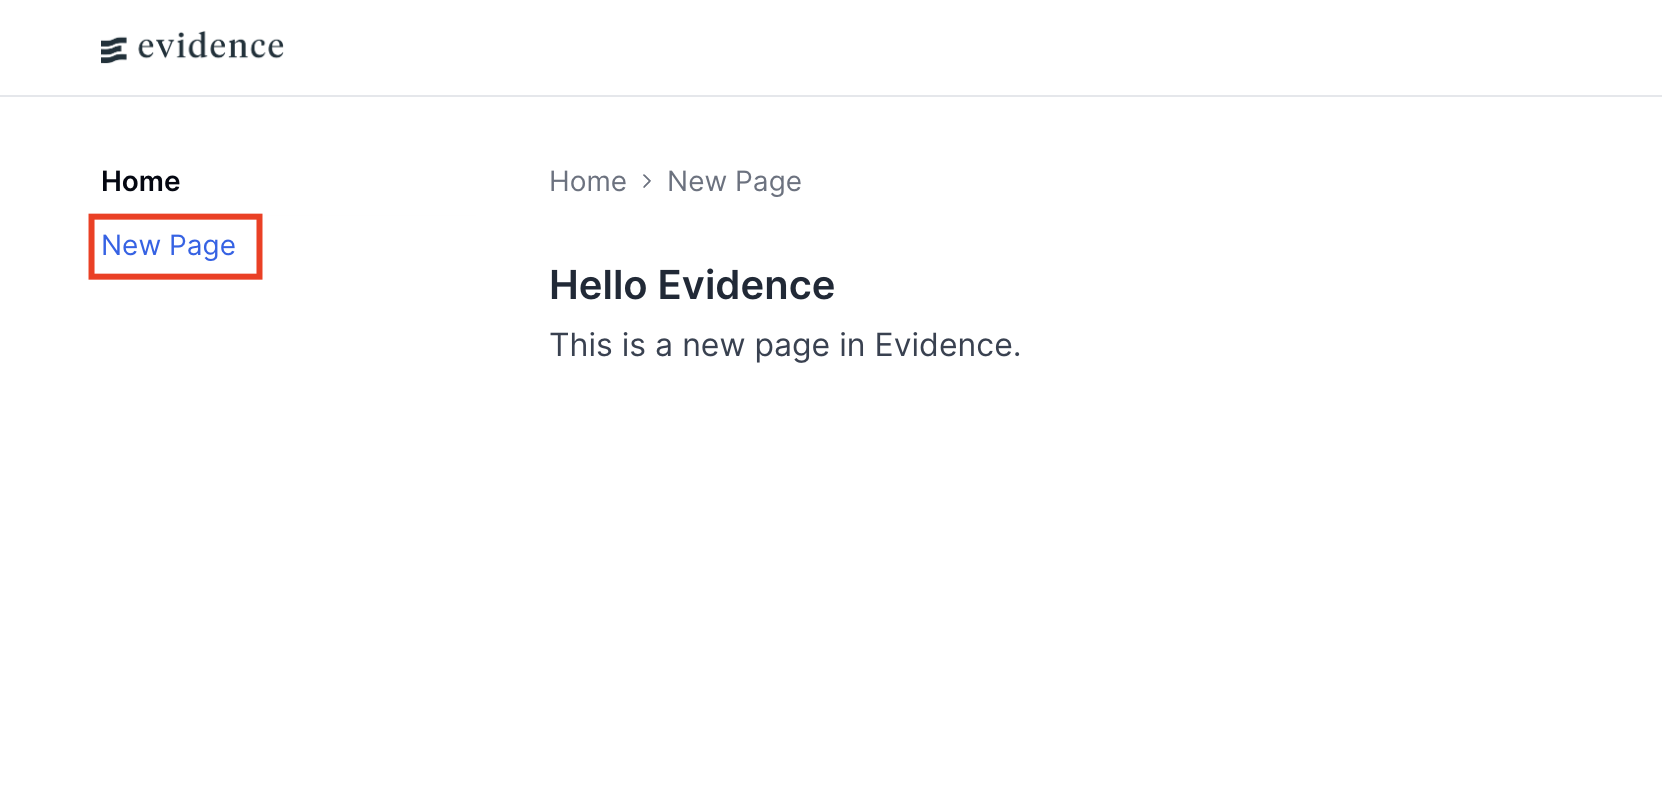
## Hello Evidence

This is a new page in Evidence.
Refresh Evidence in your browser. You should see your new page in the sidebar:
3. Write Markdown
Make some more changes to the page. You'll see them reflected "live" in the browser, immediately after saving. There is no need to restart the server.
This is called hot reloading (HMR), and it allows you to see your changes in real-time as you are building your page.
Evidence pages are .md files, and are written in a popular language called Markdown. You can learn more about Markdown here.
You can also insert HTML directly into your page if you need more control.
Here are some examples of Markdown and HTML to try:
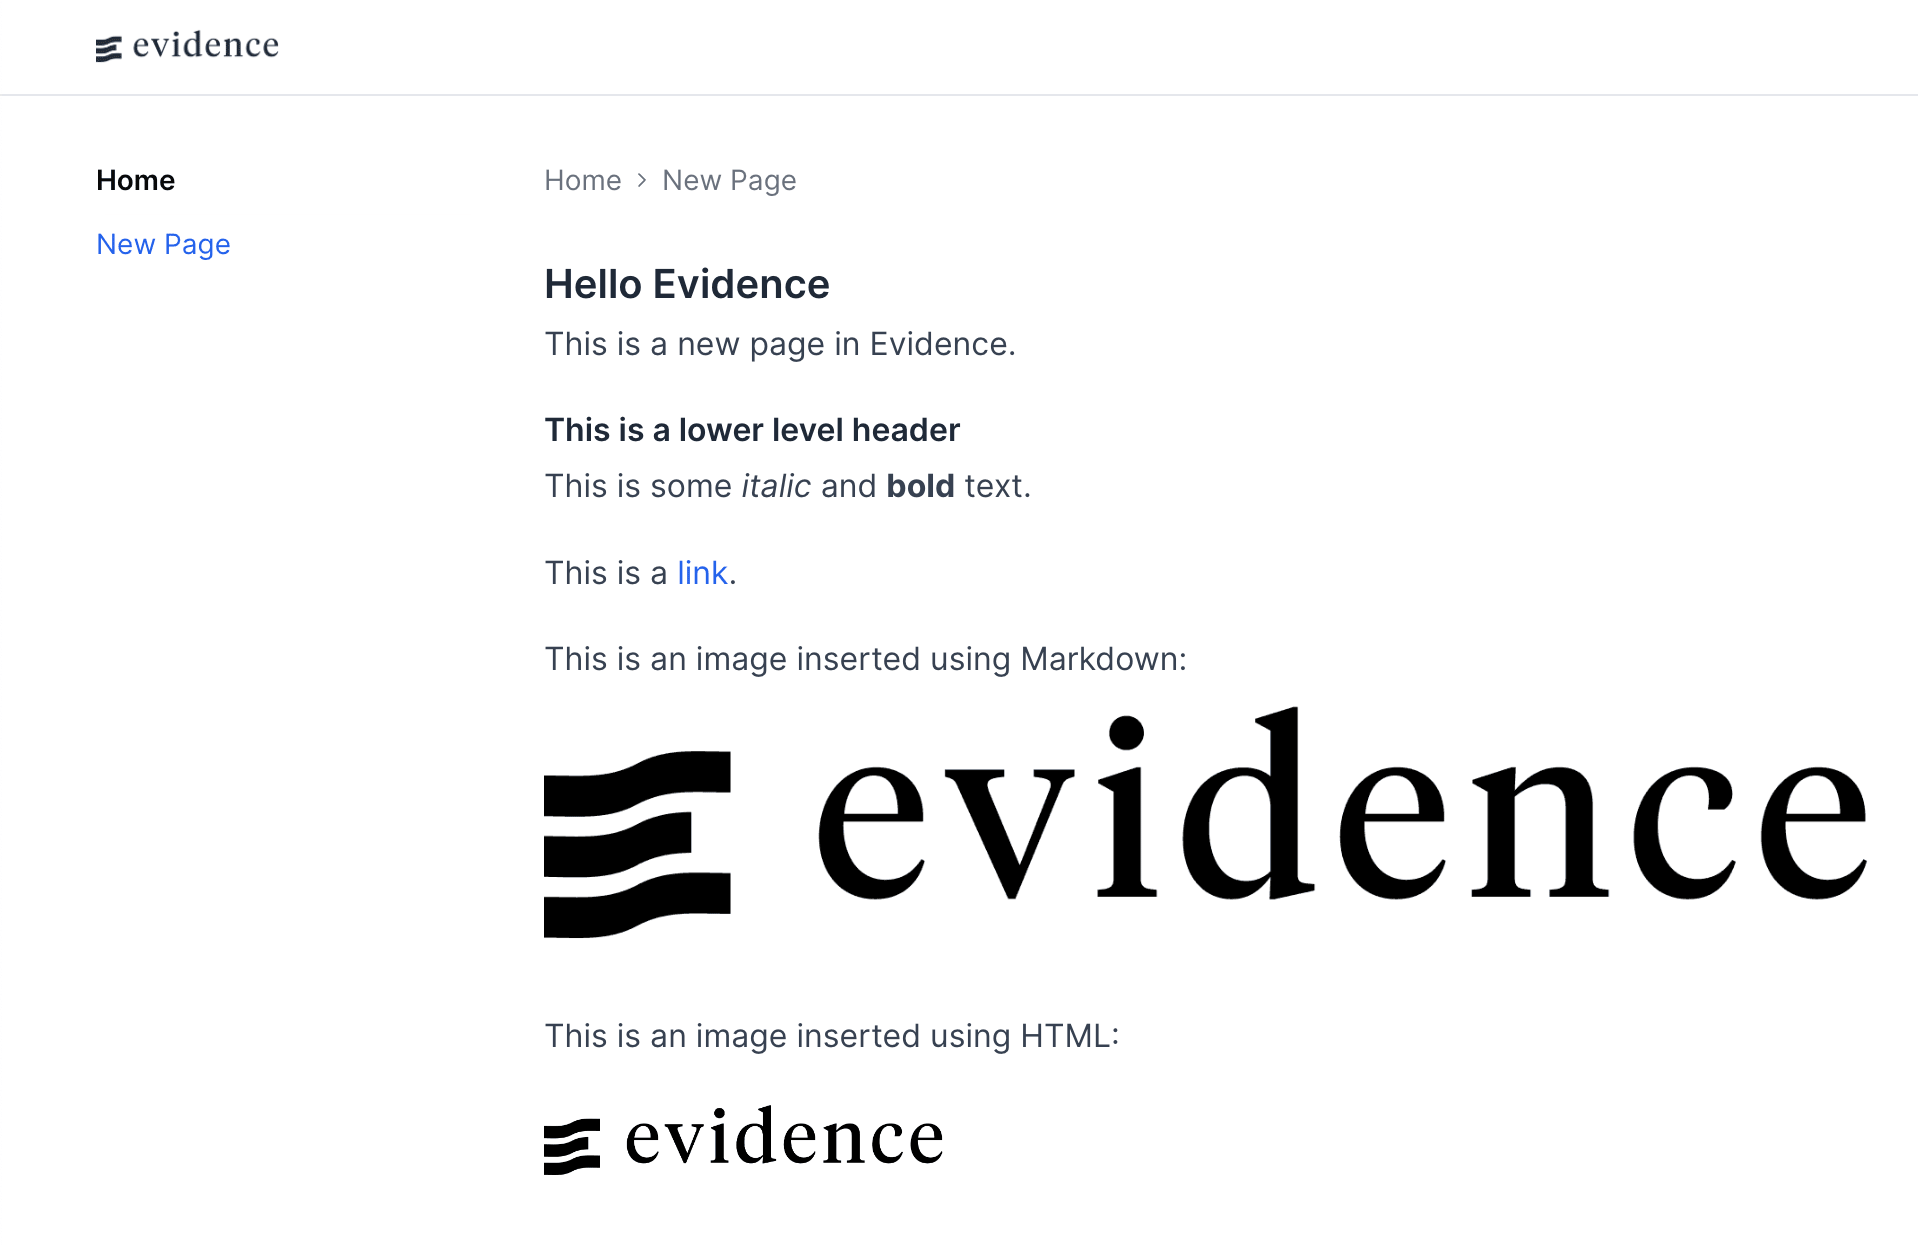
## Hello Evidence
This is a new page in Evidence.
### This is a lower level header
This is some *italic* and **bold** text.
This is a [link](https://evidence.dev).
This is an image inserted using Markdown:

This is an image inserted using HTML:
<img src="https://evidence.dev/brand-assets/wordmark-black.png" alt="evidence logo" class="w-72"/>
Here's how it will look when rendered in the browser:
Now that you know how to create and edit pages, let's move on to working with data.
Working with data
4. Understand data sources and queries
Navigate to localhost:3000/settings in your browser.
Here you'll find our demo dataset, needful_things. It is a DuckDB database, which is one of many databases that Evidence supports.
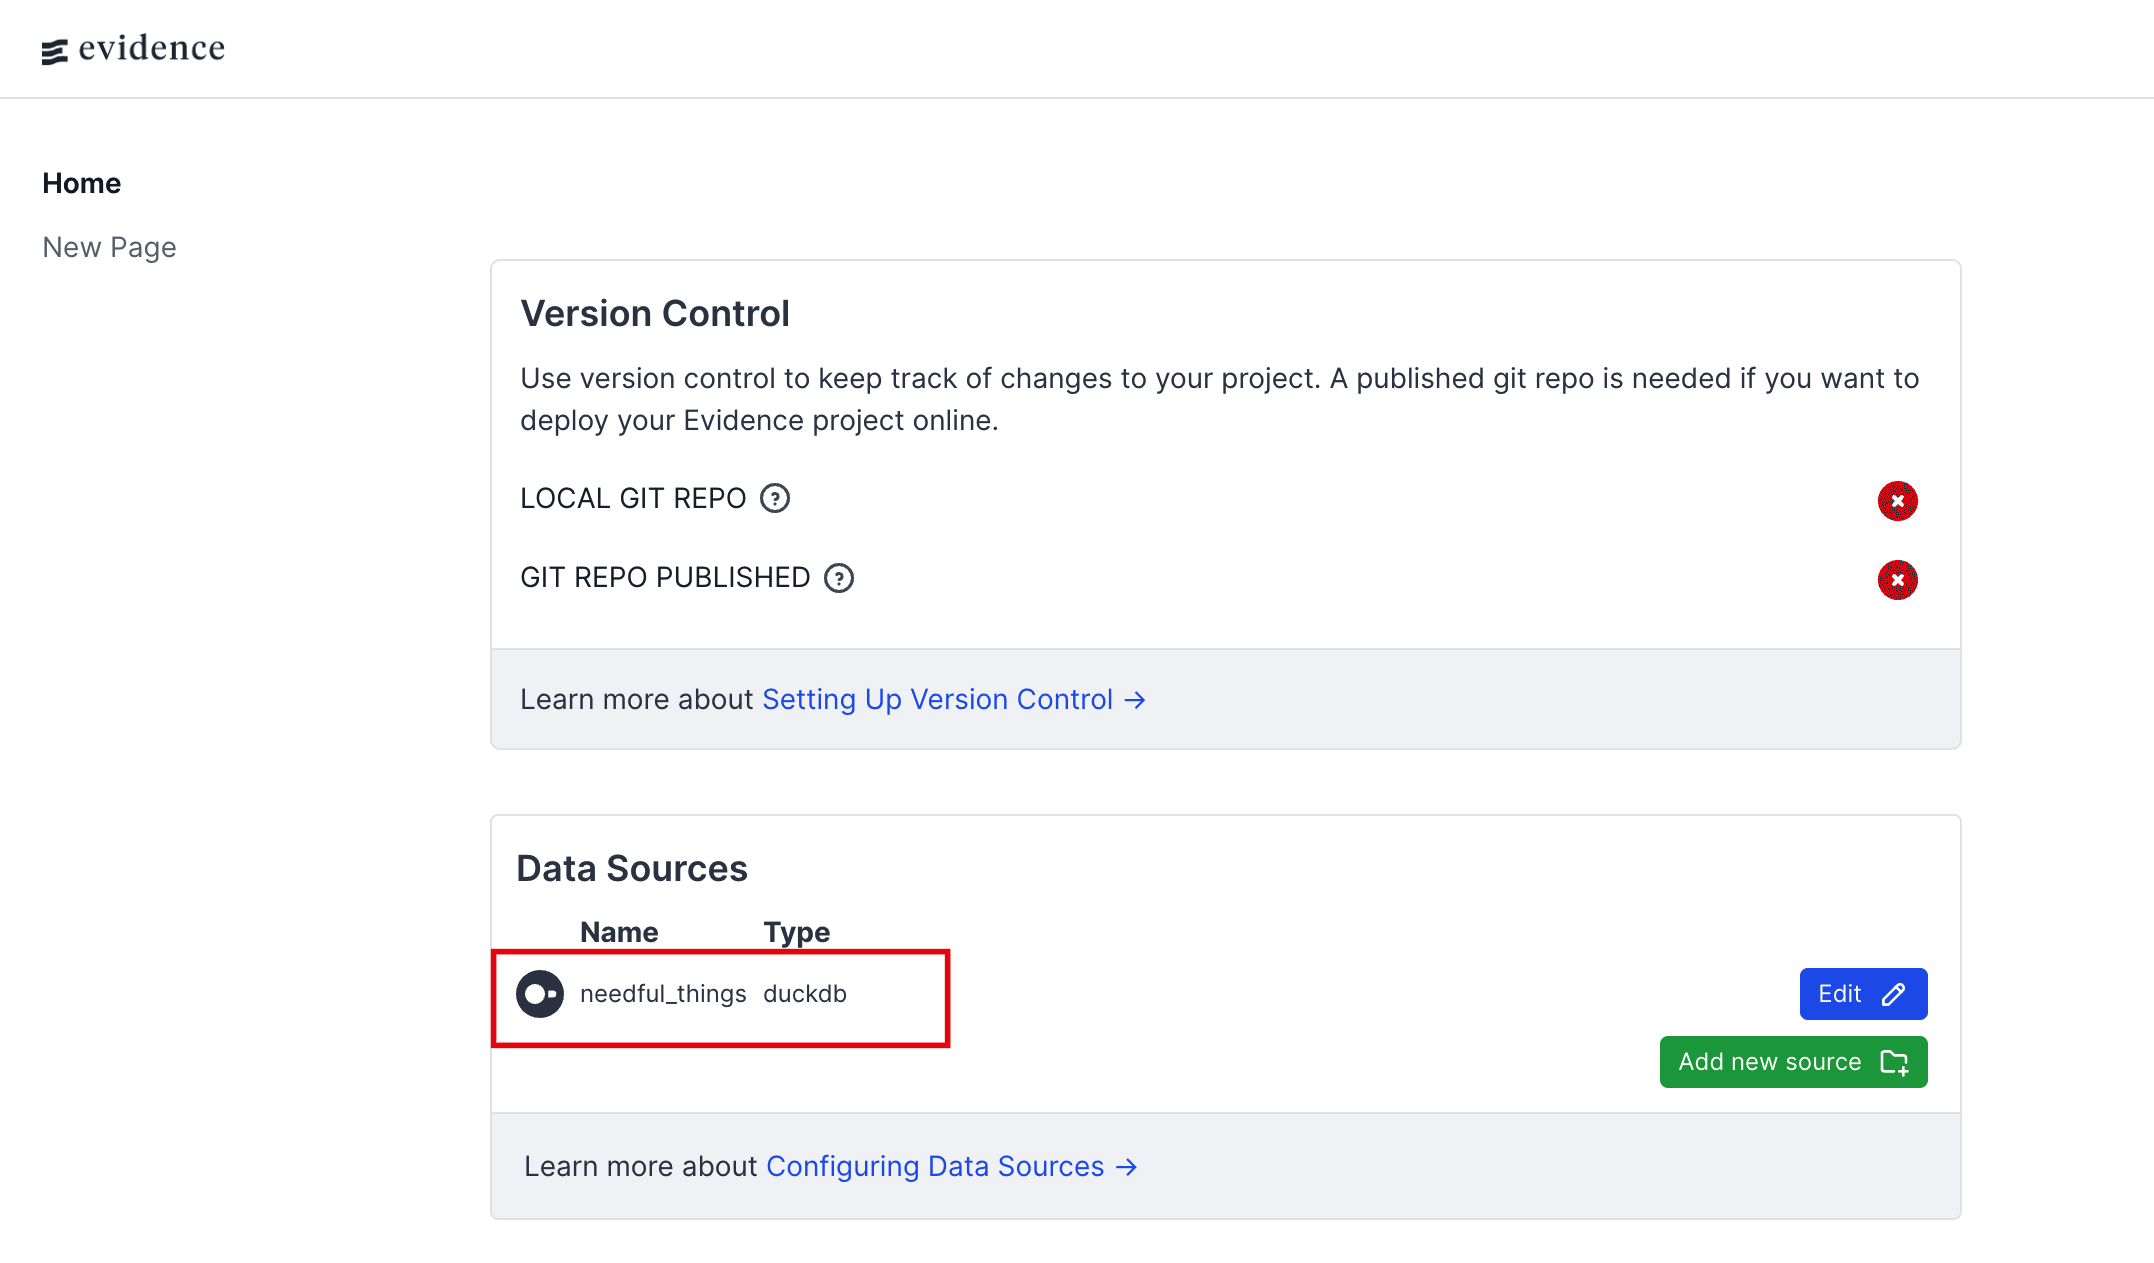
Later in this tutorial you will learn how to add a new data source. For now, we will use needful_things to write a source query.
A data source in Evidence always consists of at least 2 types of files, but may have more.
- A connection.yaml file. Any non-secret configuration needed to connect to your data source will be saved here. This file is automatically generated when you create a new data source via the
/settingspage. - Source queries allow you to filter and transform your data source before using it on a page. You may not need all of the tables from
needful_things, or you may only need a few columns from a certain table. Your source query should be written in the dialect of SQL that matches your data source. A single data source can have multiple source queries. - (Sometimes) A connection.options.yaml file. Any secret credentials needed to connect to your data source will be saved here (base64 encoded). This file is automatically generated when you create a new data source via the
/settingspage. - (Sometimes) A data file itself. In our example, all of our data sits within a file called
needful_things.duckdb.
You will see this reflected in the folder structure for each data source under the sources folder:
sources/
`-- needful_things/
   |-- connection.yaml
   |-- needful_things.duckdb
   `-- orders.sql
There is no connection.options.yaml file in this case, as the duckdb data source does not have any secret credentials.
5. Set up a source query
Add a new .sql file to the sources/needful_things directory. Name it my_query.sql, or a name of your choice.
In this file, write a query to select all columns from the orders table:
my_query.sql
select * from ordersSave the file. Later, you'll be able to refer to this data source as needful_things.my_query.
6. Run sources
Once you have configured source queries, you need to run sources to actually execute them.
If your dev server is running, sources will run automatically if you make changes to your queries.
If your data source itself has changed, or if you are building pages for deployment, you may need to run sources manually from the Command Line:
npm run sourcesWhat does it mean to run sources?
Data from various sources and formats (i.e. Snowflake, a Postgres database, and a CSV) normally cannot be queried and joined using the same syntax or SQL dialect. Evidence transforms queries from all data sources to create one unified data cache, which can then be used within your pages.
Learn more at at Core Concepts > Data Sources.
7. Set up a Markdown Query
In order to make data from the data cache available for use on pages, you must create a Markdown query for it.
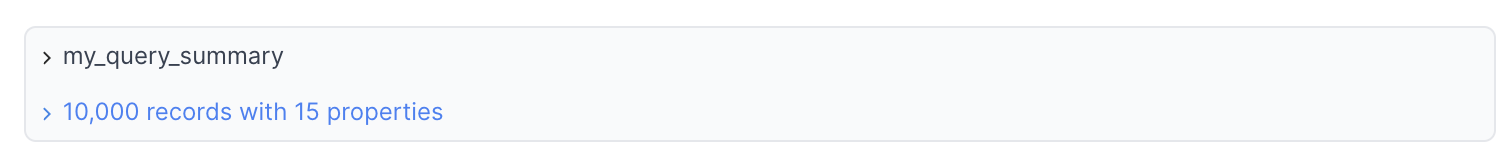
Clean up everything from your page, and add the following to create a Markdown query named my_query_summary:
new-page.md
## Hello Evidence

### Orders Table

```my_query_summary
select * from needful_things.my_query
```
Refresh, and you'll see a grey box that looks like this:
We'll use this data in the next section!
What is the difference between a Source Query and a Markdown Query?
A source query is run directly against your data source, and must be written in the dialect of SQL that matches it. Running sources populates the data cache, which is not directly accesible by components. Sources can be run manually.
A Markdown query is written in the DuckDB dialect, and is run against the data cache. Markdown queries run with every page load, and their outputs are directly accessible by components within your pages.
To learn more about Markdown queries, including how to reuse them across pages, take a look at Core Concepts > Markdown Queries.
Adding components
8. Create a Data Table
One simple way to display data is with a Data Table. Add a DataTable component that uses my_query_summary as its data source:
new-page.md
## Hello Evidence

### Orders Table

```my_query_summary
select * from needful_things.my_query
```

<DataTable data={my_query_summary} />
Refresh the page in your browser, and you should now see:
Very nice - you just made your first Evidence component. Let's refine things a bit.
The Markdown query isn't doing much at the moment. It's simply displaying all 10,000 records and all columns. We can make it more useful.
Let's say we want to pull the 100 most recent orders, in order to send these customers a discount code. Change the Markdown query to:
```my_query_summary_top100
select
   order_datetime,
   first_name,
   last_name,
   email
from needful_things.my_query
order by order_datetime desc
limit 100
```
Now refresh, and notice that your table has changed to show only the most recent 100 orders, with only the table columns you specified:
You can further select or rename the columns that appear in your table by specifying them in the DataTable component:
<DataTable data={my_query_summary_top100}>
   <Column id=order_datetime title="Order Date"/>
   <Column id=first_name />
   <Column id=email />
</DataTable>
This will display:
A Data Table is a built-in component of Evidence, and there are many more. To see a full list of components, take a look at the left-hand sidebar, or go to All Components.
9. Create a Bar Chart
Next, let's visualize orders over the past year using a Bar Chart. Add the following to your page. Notice that we are creating a new Markdown query called orders_by_month:
### Orders by Month

```orders_by_month
select order_month, count(*) as orders from needful_things.my_query
group by order_month order by order_month desc
limit 12
```
<BarChart
    data={orders_by_month}
    x=order_month
    y=orders
	xFmt="mmm yyyy"
	xAxisTitle="Month"
	yAxisTitle="Orders"
/>
And you should see:
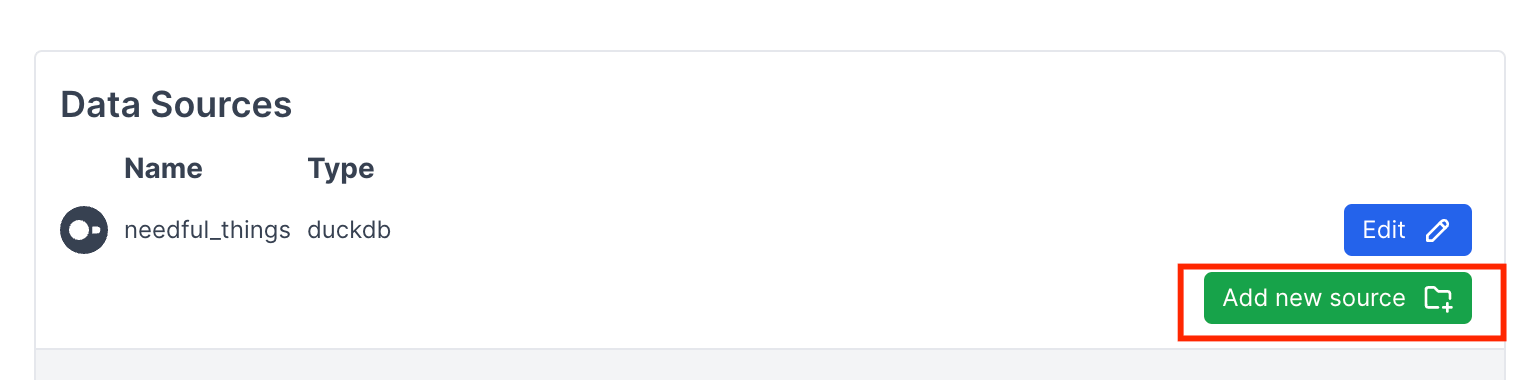
10. Connect a new CSV data source
Go to localhost:3000/settings, and select Add new source:
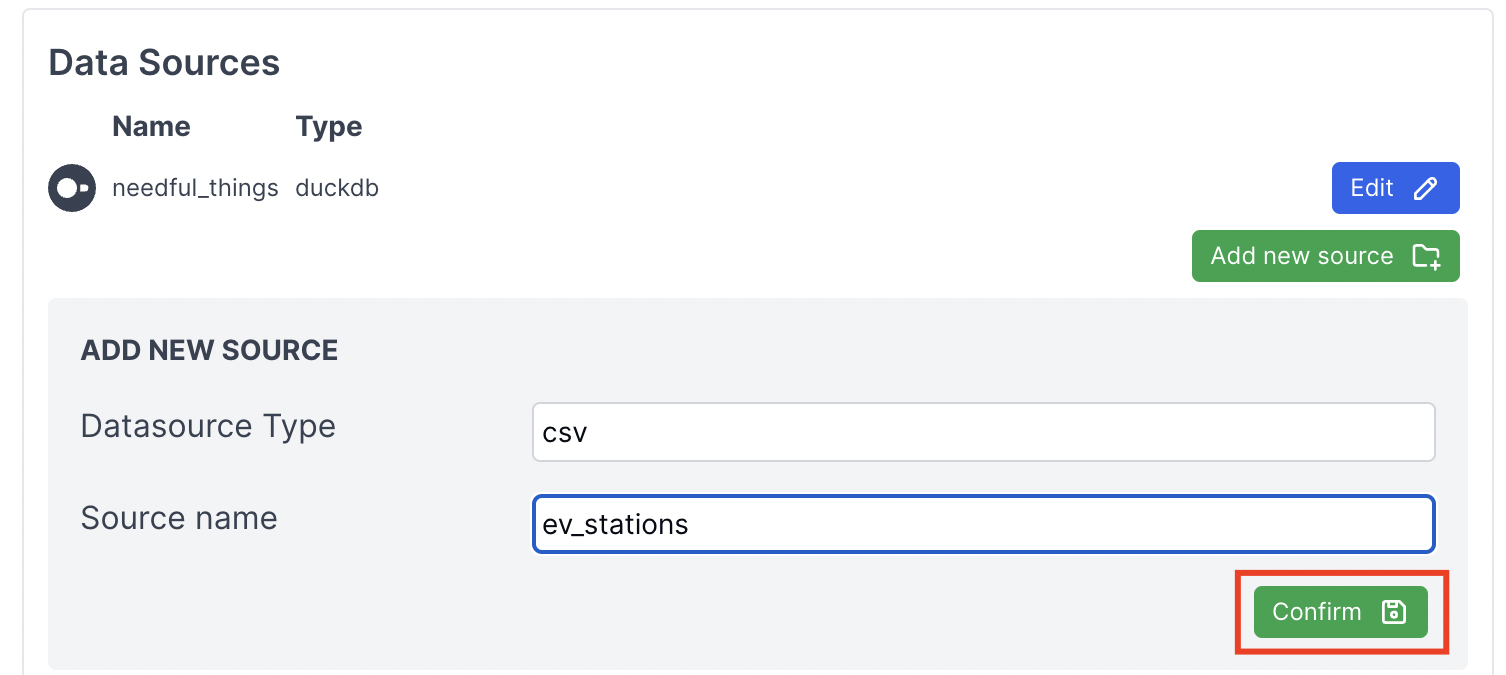
Choose CSV as the source type, and upload a CSV file of your choice.
Here, we'll use us_alt_fuel_stations.csv - a public data source on EV charging stations across the US.
Select Source Type: CSV, and give your source a name. Hit Confirm:
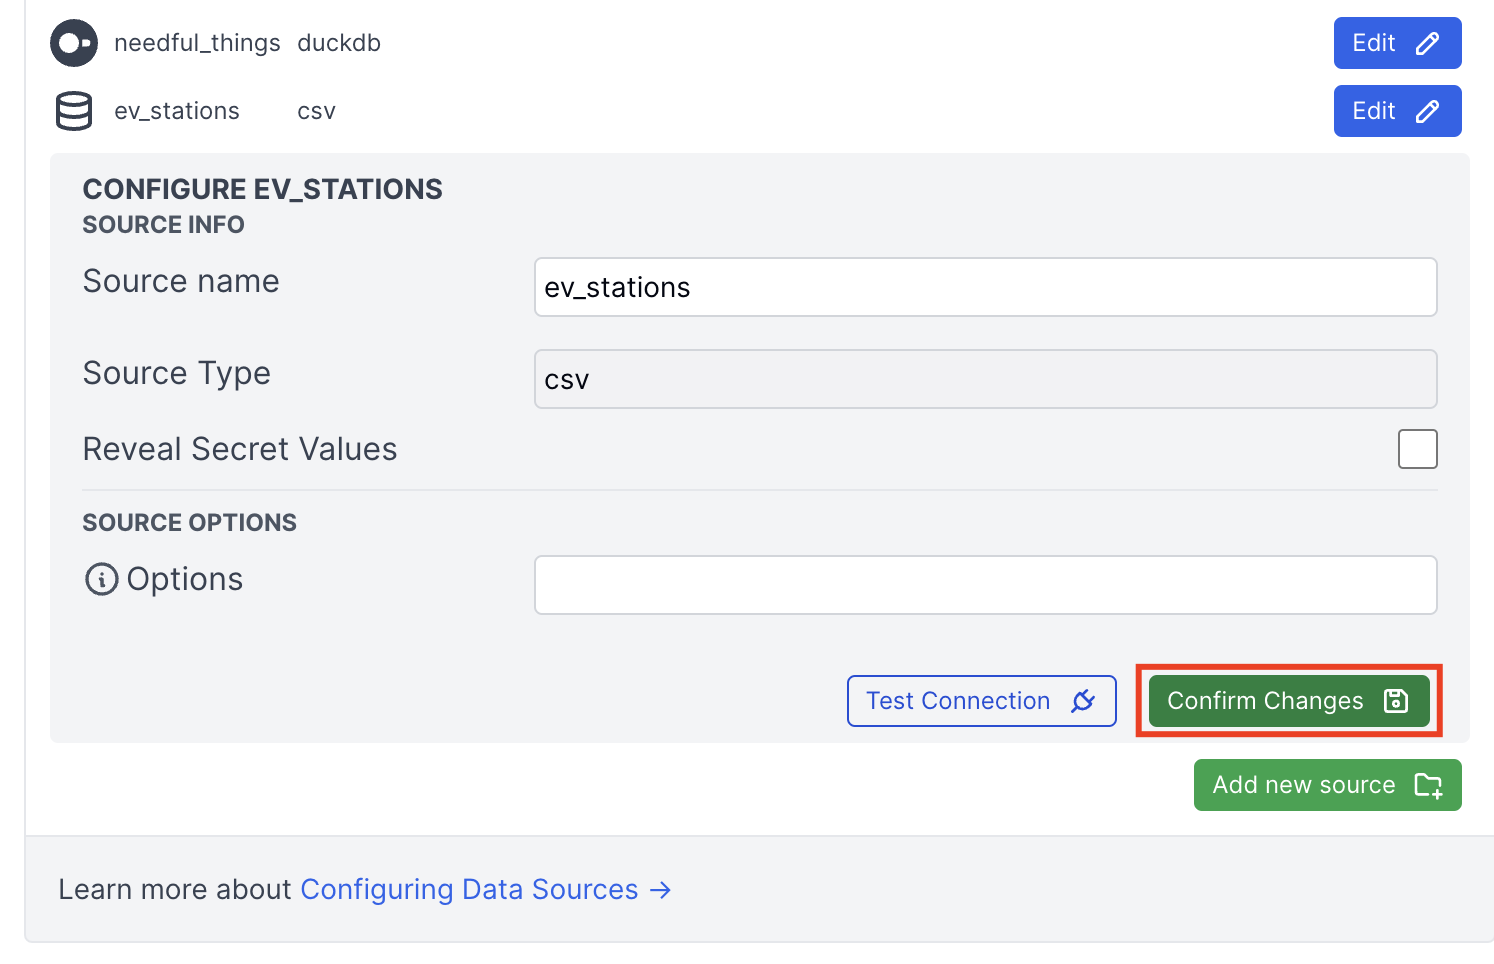
You can read about various configuration options for CSV files here. For now, leave this blank, and hit Confirm Changes:
You should now see your new source under the sources folder. Copy your CSV file into it:
sources/
`-- ev_stations/
   |-- connection.yaml
   |-- connection.options.yaml
   `-- us_alt_fuel_stations.csv
That's it! You've set up a new data source. If you'd like to use it, try adding the following Markdown Query and the USMap component:
### EV Map
```ev_map
select State, count(*) AS ev_station_count from ev_stations.us_alt_fuel_stations
where State not in ('CA')
group by State order by ev_station_count desc
```

<USMap data={ev_map} state=State abbreviations=true value=ev_station_count/>
And you should see:
That's it! You now know the basics of setting up data sources, writing queries, and creating components in Evidence.
Next steps
- Explore other components: All Components
- Learn how to deploy your Evidence app: Deployment
- Learn more about writing and organizing Markdown queries: SQL Queries
Help and support
If you need help, or have corrections and suggestions for this tutorial, please join the Evidence Slack community.