

US Map
Compare a metric across US states using a flat choropleth map. For other regions see the more general Area Map component.
<USMap
    data={state_population}
    state=state_name
    value=population
/>
Examples
Color Scales
colorScale=info
<USMap
    data={state_population}
    state=state_name
    value=population
    colorScale=info
/>
colorScale=positive
<USMap
    data={state_population}
    state=state_name
    value=population
    colorScale=positive
/>
colorScale=negative
<USMap
    data={state_population}
    state=state_name
    value=population
    colorScale=negative
/>
Custom Color Scale
<USMap
    data={state_population}
    state=state_name
    value=population
    colorScale={['maroon','white','#1c0d80']}
    legend=true
/>
Legend
Default
<USMap
    data={state_population}
    state=state_name
    value=population
    legend=true
/>
With Filter
<USMap
    data={state_population}
    state=state_name
    value=population
    colorScale={['maroon','white','#1c0d80']}
    legend=true
    filter=true
/>
Links
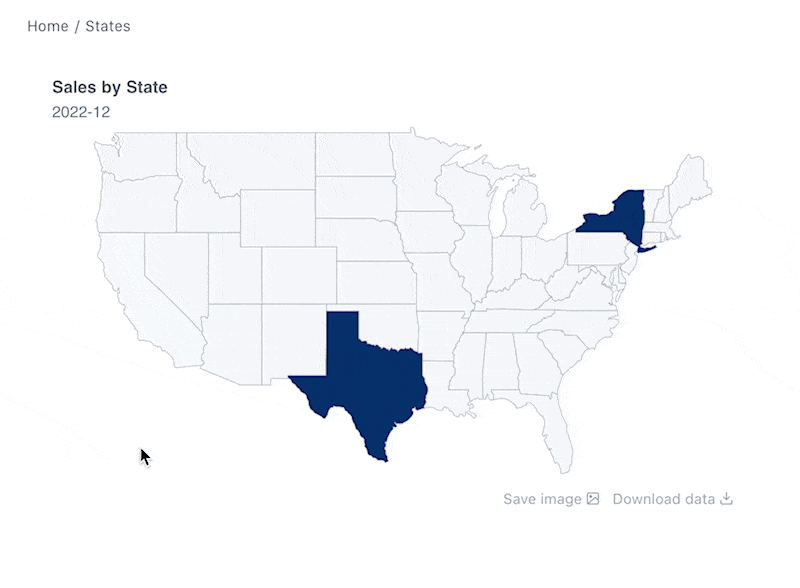
<USMap
	data={state_current}
	state=state
	value=value
	abbreviations=true
	link=state_link
	title="Sales by State"
	subtitle="{most_recent_month[0].month}"
/>
State Abbreviations
<USMap data={map_data} state=state_abbrev value=sales_usd abbreviations=true />Options
Data
Query name, wrapped in curly braces
- Options:
- query name
Column to be used as the name for each state
- Options:
- column name
Column to be used as the value determining the colour of each state
- Options:
- column name
Colour scale to be used. To use a custom color palette, see the colorPalette prop
- Default:
- info
Custom color palette to use for setting state colors. Overrides colorScale. E.g., {['#cf0d06','#eb5752','#e88a87']}
- Options:
- array of color codes (can be CSS, hex, RGB, HSL)
Minimum value for the colour scale. Anything below the minimum will be shown in the same colour as the min value
- Options:
- number
Maximum value for the colour scale. Anything above the maximum will be shown in the same colour as the max value
- Options:
- number
Title appearing above the map. Is included when you click to save the map image
- Options:
- string
Subtitle appearing just above the map. Is included when you click to save the map image
- Options:
- string
Column containing links. When supplied, allows you to click each state on the map and navigate to the link
- Options:
- column name
Format to use for values (see available formats)
- Options:
- Excel-style format | built-in format | custom format
Text to display when an empty dataset is received - only applies when emptySet is warn or pass, or when the empty dataset is a result of an input component change (dropdowns, etc.).
- Options:
- string
- Default:
- No records
- Default:
- canvas
Custom Echarts Options
Custom Echarts options to override the default options. See reference page for available options.
- Options:
- {{exampleOption:'exampleValue'}}
Custom Echarts options to override the default options for all series in the chart. This loops through the series to apply the settings rather than having to specify every series manually using echartsOptions See reference page for available options.
- Options:
- {{exampleSeriesOption:'exampleValue'}}
Interactivity
Group name to connect this chart to other charts for synchronized tooltip hovering. Charts with the same connectGroup name will become connected